Introduction
Investment is made by the business firms in order to earn extra income in the business and to make effective use of idle cash that is available in the business. It is very difficult task to determine the avenues where investment must be made. It can be said that it is very tough task to choose specific firms in which corpus must be spend to purchase shares. In the report, two airlines are selected which are Ryanair and Easyjet. Both these firms are low cost carriers in the UK and entire Europe. In order to select best firm out of both ratios are computed which are related to profitability and investment. Results of these ratios are interpreted and on this basis specific firm is selected for making investment.

Interpretation
Gross Profit Ratio: Gross profit ratio reflects the extent to which firm is controlling expenses in its business (Damodaran, 2012). It can be seen that gross profit ratio of the firm is increasing consistently. This reflects the firm have strong control on its direct expenses. This ratio also reflect the proportion of sales that is covered by the gross profit. Table given above indicated that Ryanair is earning 35% to 40% gross profit in its business. This reflects that mentioned firm have stiff control on its direct cost.
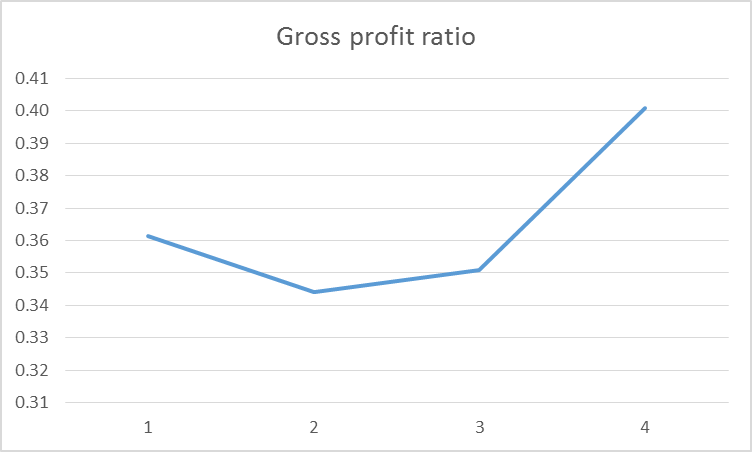
FIGURE1: Gross Profit Ratio of Ryanair
It can be said that firm give excellent performance in its business.
Net Profit Ratio: Net profit ratio is another ratio which reflects the firm capability to control indirect expenses (Arrow and Kruz, 2013). Indirect expenses are those expenses that are not directly related to the production of goods and services. It can be seen from the table given above that net profit ratio of Ryanair is fluctuating consistently. This reflects that firm have very less control on its expenditures. On comparison of gross and net profit ratio of the Ryanair it can be seen that there is huge difference between both. It can be said that firm have very less control on its indirect expenses due to which it earn net profit of 13% to 15% in its business in the last four years.
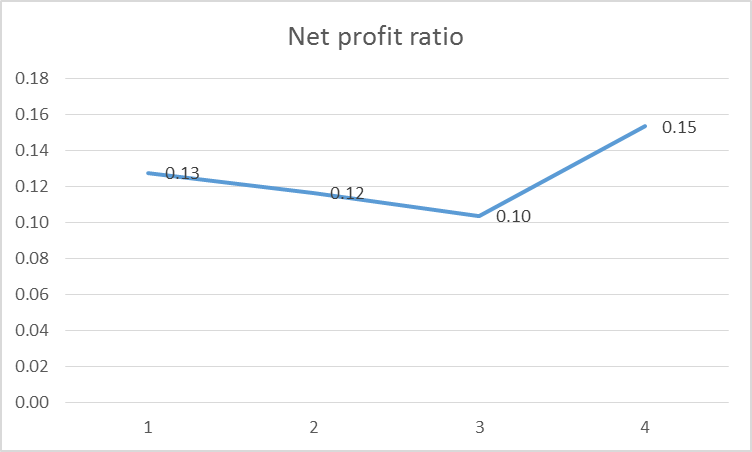
FIGURE 2: Net Profit Ratio of Ryanair
Operating Profit Ratio: Operating profit ratio reflects the portion of sales that is covered by the firm operating profit (Arrow and Lind, 2014). Higher the value of operating ratio it is assumed that firm have strong control on its operating expenses. It can be seen from the results of the table that there is a high degree of similarity between operating profit and net profit ratio. It can be said that Ryanair not only failed to control its indirect expenses but it have very loose control on its operating expenses.
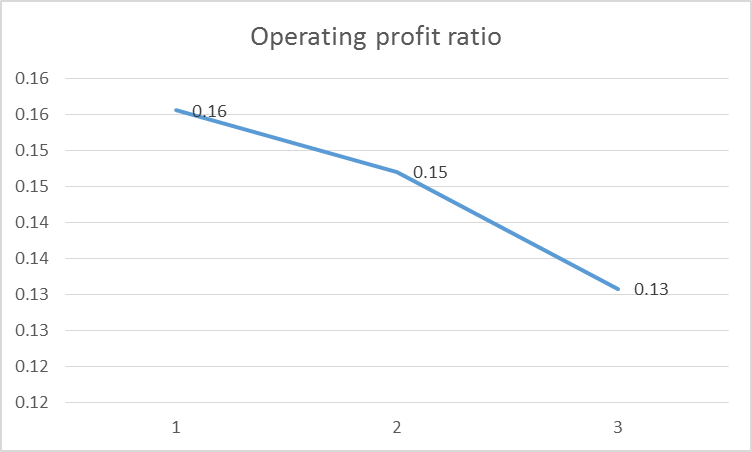
FIGURE 3: Operating Ratio of Ryanair
Interpretation
Gross Profit Ratio: It is clear from the table that firm is earning good amount of profit in its business. Gross profit ratio of the Easyjet is increasing consistently. The only decline is observed in the month of the FY 2014. It can be said that firm is having strict control on its direct expenses. It successfully implements its cost control strategy in the business.
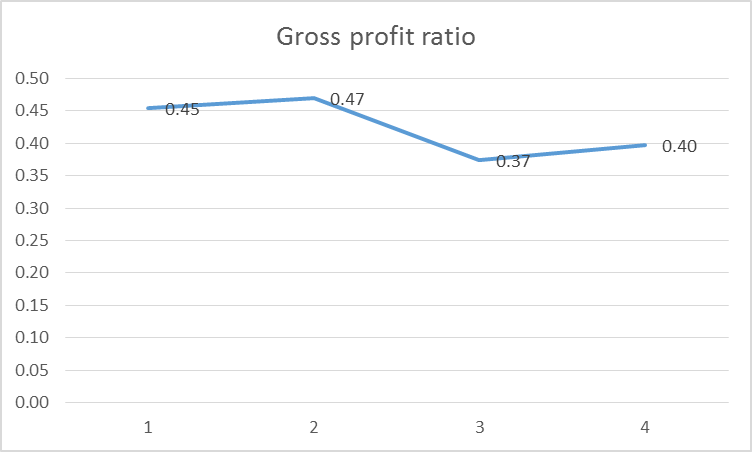
FIGURE 4: Gross Profit Ratio of Easyjet
Net Profit Ratio: Net profit ratio of the Easyjet is increasing consistently which reflect that firm is giving good performance in its business. However, the percentage of net profit on sales is very low for the firm. It can be seen from the table that net profit of the firm is covering 7 to 12% of sales. It can be said that net profit ratio of the firm is increasing which is good for the business but value of same is very low which is matter of concern for the firm.
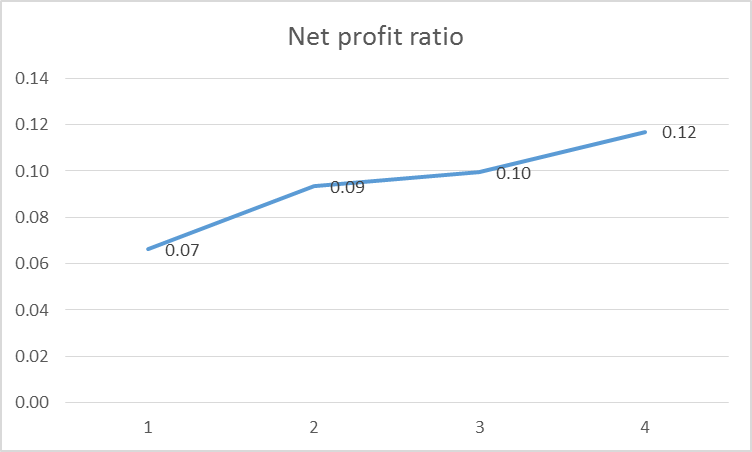
FIGURE 5: Net Profit Ratio of Easyjet
Operating Profit Ratio: Like net profit ratio operating profit ratio of the firm is increasing consistently. It can be said that firm is observing growth in its operating profit. Operating profit of Easyjet is increasing from 9% to 14% which is good plunge in the operating profit ratio. However, current performance cannot be considered satisfactory for the business firm.
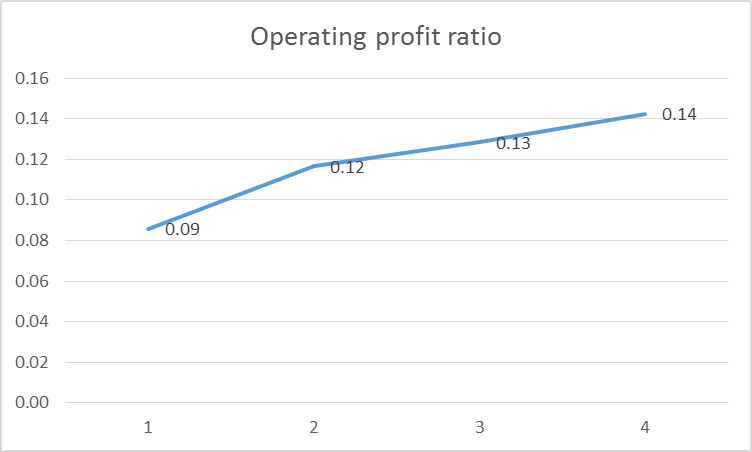
FIGURE 6: Operating Profit Ratio of Easyjet
Interpretation
Debt Equity Ratio: Debt equity ratio reflect the capital structure of the firm. This ratio reflects that capital mix of the firm. By using debt equity ratio investors make their investment related business decisions (Morel, Palier and Palme, 2012). In case of debt it is necessary to pay interest every year irrespective of profit. If in specific year firm face loss in its business then burden of finance cost will increase on same. It can be seen from the above table that debt equity ratio of Ryanair is balanced. This is because most of times value of debt equity ratio of the firm is equal to each other. It can be said that firm is in safe zone and burden of finance cost is moderate on same.
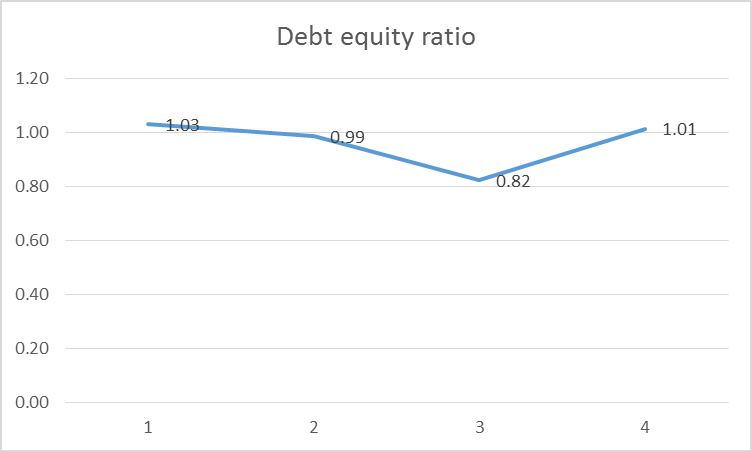
FIGURE 7: Debt equity ratio of Ryanair
Earnings Per Share: It is one of the most important ratio because it reflect the amount of earning that is received on per share that is hold by an investor (Schwartländer. and et.al., 2011). It can be said that this ratio reflects the total earning that is received by the investor on shares he hold as real owner of the firm. Dividend is paid to the investor out of the relevant earning amount. It can be observed from the table that earning per share of the firm is fluctuating consistently. However, this decline is very low and is tolerable for the investors. It can be seen from the table given above that EPS increased from 2 to 3.
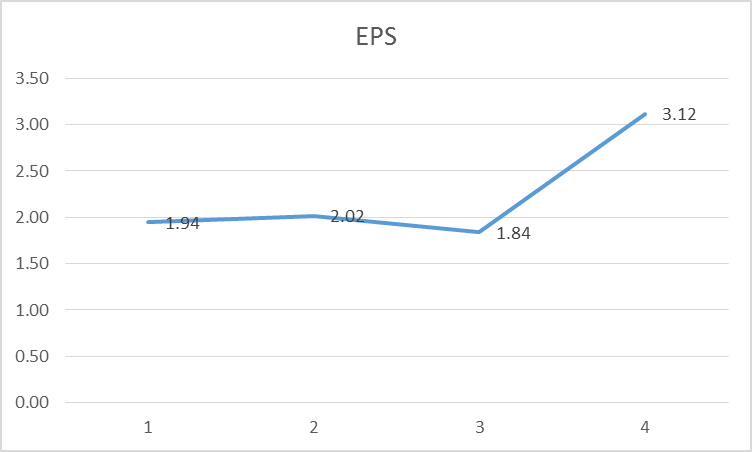
FIGURE 8: EPS of Ryanair
Price Earnings Ratio: Price earnings ratio reflects the valuation of share price. It can be observed from the table that price earnings ratio of the firm increases from 0.01 to 0.04. This reflects that in past years value of shares of the firm increases (Kojima, 2010). Valuation of Ryanair share increase because EPS and share price elevate in the relevant time period. Elevation in share price mainly contributed to increase in valuation of Ryanair shares. To some extent it can be assumed that firm shares are overvalued because rate of growth in shares price is higher than elevation rate of earning.
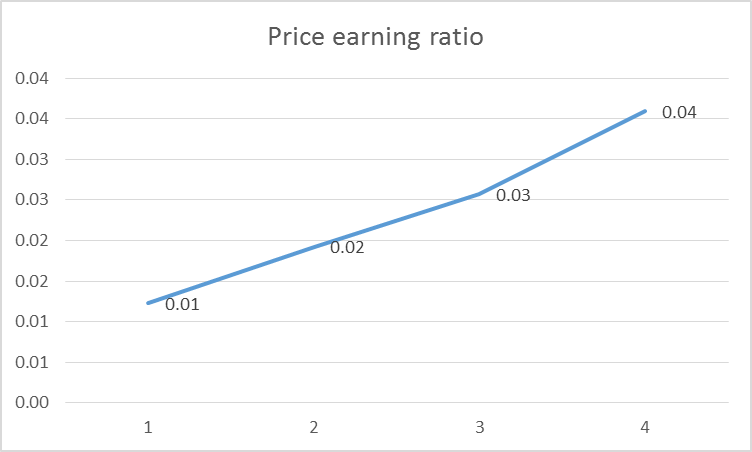
FIGURE 9: Price Earning Ratio of Ryanair
Interpretation
Debt Equity Ratio: Debt equity ratio of the firm is declining continuously and it can be said that the proportion of debt is very low in the capital structure in comparison to equity. This is good for the business and on this basis it can be said that there is very low finance cost of the business firm. However, this is also negative point for the business firm because shareholders have very strong control on the firm and to great extent affects the firm business operations. However, from point of view of debt it can be said that firm is in better condition.
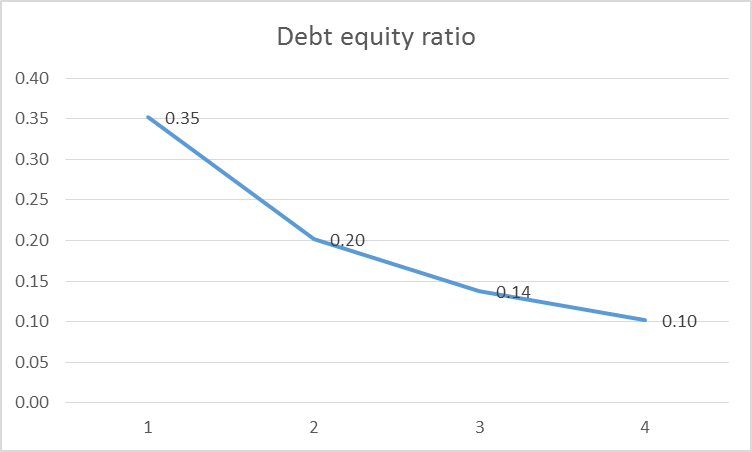
FIGURE 10: 10 Debt equity ratio of Easyjet
Price-Earnings Ratio: Price earnings ratio of Easyjet is increasing consistently which reflects that value of the shares of the Easy jet is elevating in past years. It can be seen that price earnings ratio increased from 185 to 301. It can be observed that share price of the firm increases at fast pace then EPS. This means that market forces play an important role in oval valuation of the Easyjet share price.
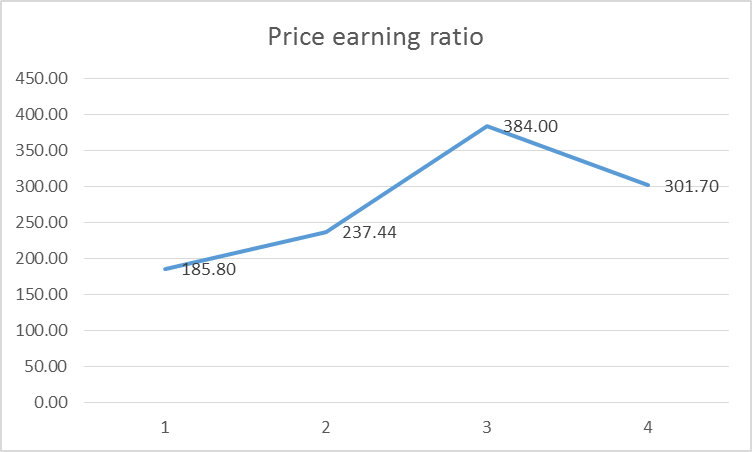
FIGURE 11: Price-earnings ratio of Easyjet
Comparison and contrast of profitability between two companies
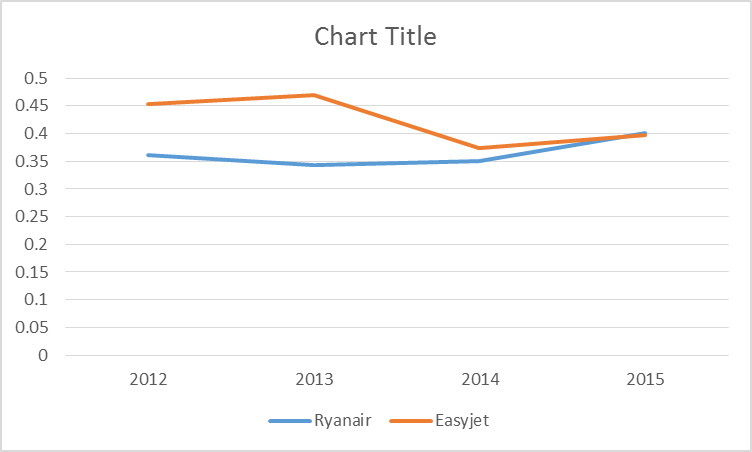
FIGURE 12: Comparison of Ryanair and Easyjet
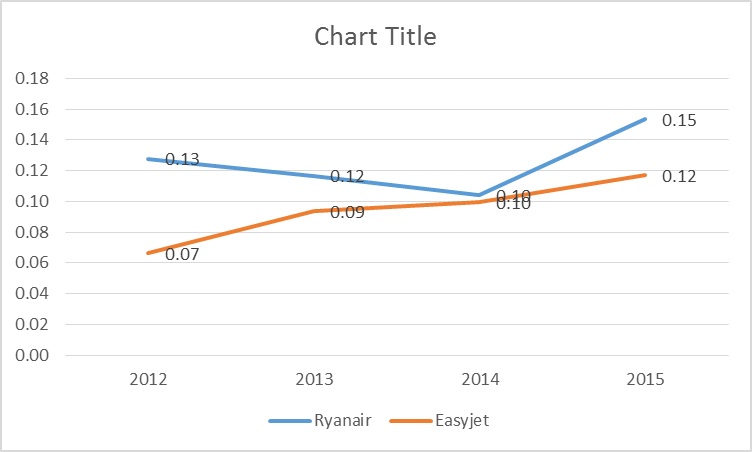
FIGURE 13: Comparison of net profit of Ryanair and Easyjet
Gross Profit Ratio: It can be seen from the first image that gross profit ratio of Easyjet is higher than Ryanair in the first three years. However, in the last year which is FY 2015 scene get changed and it can be said that both firms give similar performance. It is clear that performance of the Ryanair slightly increase in FY 2015 but same heavily declines in case of Easyjet. It can be said that both firms are in same position in terms of gross profit ratio. In case of Easyjet it is clear that in past few years control on direct cost reduces in comparison to Ryanair. Due to elevation in service delivery cost and strong competition from rivals like Easyjet failed to earn high revenue in its business. Due to this reason its gross profit ratio value declined sharply in past time period.
Net Profit Ratio: In case of net profit ratio it can be observed that performance of the Ryanair improve sharply in the FY 2015. This happen because number of customers increase in business. Apart from this cost was reduced by generating economies of scale in the business. In case of Easyjet improvement in performance is improved but same takes place at low rate. It can be said that in case of Easyjet elevation in number of customers is taking place at a very slow pace. Apart from this, heavy investment on increasing fleet size and innovation of same is another reason due to which firm earn less profit in its business.
It can be said that direct cost for Easy jet get increased in the past time period. However, due to adoption of cost control strategy firm manage to control indirect expenses in its business but only to some extent. Contrary to this, in case of Ryanair gross profit ratio increased but at very slow pace. On other hand, good plunge is observed in the net profit ratio of the firm. On comparison of the both business firms it is clear that Ryanir is in much better conditiion then Easyjet because it have stiff control on its expenses in compariosn to rival firm.
Compare and contrast investor performnace ratio of Ryanair and Easyjet
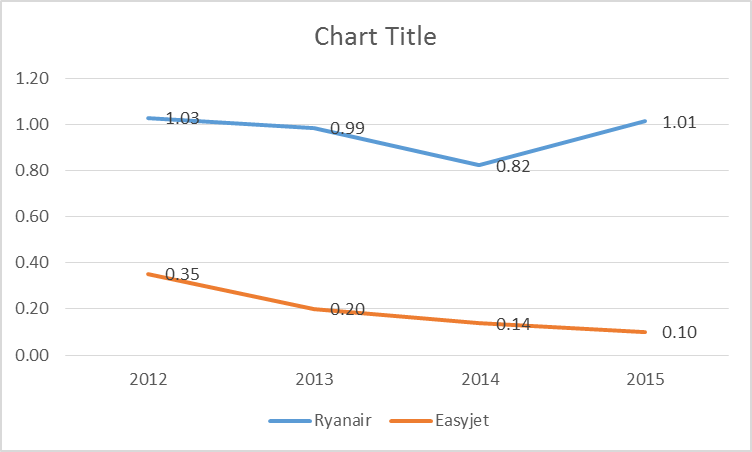
FIGURE 14: a Comparison chart of debt equity ratio for both firms
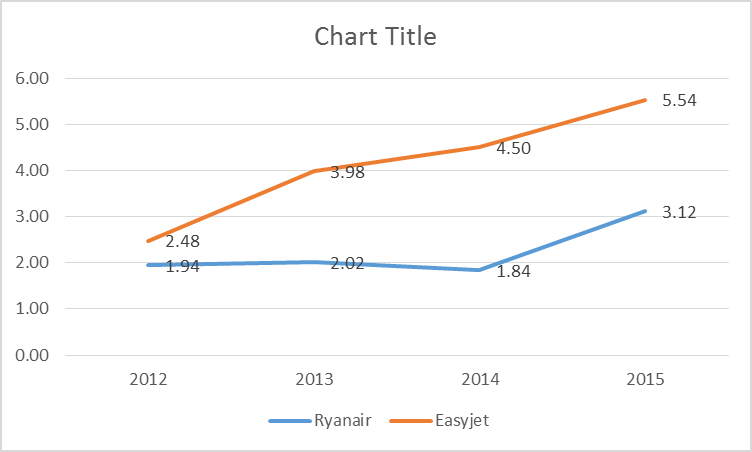
FIGURE 15: Comparison chart on EPS
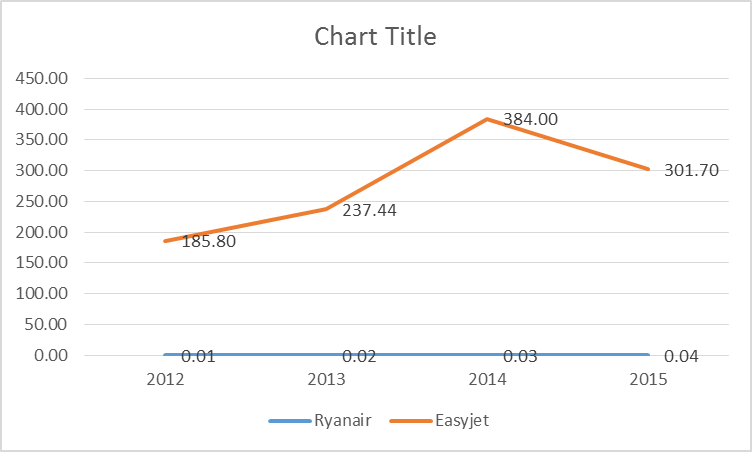
FIGURE 16: Comparison chart on PE ratio of firms
Interpretation
Debt Equity Ratio: It can be seen from the chart that debt equity ratio of Ryanair is increasing consistently. On other hand, in case of easy jet debt equity ratio decline. Capital structure is balanced in case of Ryanair but same in case of Easyjet is not balanced which is not good for the latter firm. Hence, it can be said that Ryanair is in better condition than Easyjet. Easyjet needs to take steps in order to restructure its capital structure. This is because high size of equity means payment of huge amount of dividend to the shareholders. If higher amount of dividend is paid to the shareholders then firm gain low amount of retained earnings in its business. Hence, it can be said that Ryanair is in better condition than Easyjet.
EPS: In case of Ryanair EPS amount is very low but in case of Easyjet same is very high. It is clear that shareholders of the Easyjet are earning higher amount of earning on per share they hold in comparison to Ryanair. On this ratio Easyjet perform better than Ryanair from investor point of view.
PE Ratio: On comparison of both firms PE ratio it can be seen that both firms' shares are overvalued. It can be seen that Easy jet shares are overvalued then Ryanair. Hence, it is clear that investors are receiving shares at higher price in case of Easyjet in comparison to Ryanair.
It is clear that capital structure of Ryanair is better than Easyjet. However, EPS of latter firm is higher than former firm. On other hand, shares of Easyjet are overvalued relative to Ryanair. On this basis it can be said that Ryanair is in better condition than Easyjet.
Conclusion
In the above part of the report analysis of Ryanair and Easyjet is done in the systematic way. In this regard, varied ratios are computed. It can be concluded that on the performance ratios that Ryanair give better performance in its business in comparison to the Easyjet in terms of profitability because former firm have stiff control on the expenses then latter firm. Hence, it can be said on the basis of fundamental analysis that profitability of Ryanair is higher than Easyjet. On other hand, in case of investor's ratio also same things is observed because Ryanair shares are undervalued in comparison to Easyjet. On other hand, mentioned firm capital structure is balanced. On the basis of values of all ratios it can be said that Ryanair is in much better condition than Easyjet in terms of profitability and capital structure as well as valuation of shares.
Recommendation
On the basis of analysis of results it is recommended that investors must make an investment in the Ryanair then Easyjet. This is because fundamentals of the former firm are very strong and its business will certainly grow at rapid pace. Mentioned firm is going to commence its operations in the new areas. Apart from this it have good image among the customers. Hence, in upcoming time period surely Ryanair will earn good profit in its business. Due to this reason it is highly recommended that investors must make investment in the Ryanair.
Read More
- Unit 3 Finance In Hospitality Sector level 5 Regent college
- Sample Report On Finance For SME
- Funding in Travel and Tourism Management Sector
- Finance Accounting Sample from Experts

UPTO55%
Avail The Benefit Today!
To View this & another 50000+ free