Introduction
Forecasting stock market is considered one of the most complicated and uncertainty issues in finance. The Efficient Market Hypothesis (EMH) (Aminimehr et al., 2022), does hold that financial markets are informationally efficient (that is, that the price of assets is fully informed). With this premise, it should be statistically impossible to be constantly outperforming or able to predict the direction of the market correctly due to the instant pricing in. But in reality, markets are prone to anomaly, behavioural biases and over-emotional responses suggesting that investors are not always rational. Such a lack of consistency between theoretical efficiency and empirical behaviour has inspired a flood of interest in alternative inputs to data and machine learning-based algorithms that attempt to reveal the presence of hidden predictive cues.
The alternative data that have been observed to be potent indicators of investor psychology in recent years include social media mood, tone of financial news, and patterns of online discussions (Duz Tan and Tas, 2020). These qualitative behavior indicators are usually predictive of what is eventually happening in the market, implying that the aggregate greater sentiment of market participants can impact the market dynamics in a manner that is not always reflected in the traditional quantitative indicators. Although historical price information is a vital part of any prediction model.
Problem Statement: It is very difficult to predict the market trends in spite of the large amount of the historical price data (Saravanos and Kanavos, 2024). The main research question that is followed in this project is as follows: Does quantitative sentiment analysis of financial news applied in combination with conventional market data contribute to better predicting trends in the S&P 500 by machine-learning models?
Research Aim: To create and test a hybrid machine learning model that combines numerical sentiment scores obtained with financial news with past data related to the stock market performance of S&P 500 to determine the future direction of the index in the long term (Khalife et al., 2024).
Key Objectives:
- To gather and digest an all-encompassing record of S&P 500 past pricing and foot traffic.
- To put together a list of financial news headlines concerning the S&P 500 and its member companies.
- To apply a sentiment analysis model (FinBERT) to extract numerical sentiment measures out of financial text.
- To combine best characteristics of market indicators (technical indicator) and sentiment indicators (polarity, intensity, volume).
- To test and evaluate various machine learning classifiers, Logistic Regression, Random Forest, XGBoost, and SVM, on both market-only and hybrid datasets.
- In order to compare the models using classification-based measures accuracy, precision, recall, F1-score, and AUC-ROC
This is a unified study that attempts to fill the gap between behavioural finance and computational intelligence by showing that signal elicited by emotion can positively influence financial prediction quantitatively.
Summary Literature Review
2.1 Traditional Approaches to Stock Market Prediction
The stock market prediction has long been based on two major schools of thought, namely; technical analysis and fundamental analysis. Technical analysis presupposes that past market behaviour in its various manifestations price and volume pattern can give some valueable information about the future. The analysts use chart pattern, moving averages and indicators of momentum like: Relative Strength Index (RSI) and Moving Average Convergence Divergence (MACD) to determine the buy or the sell signal (Ming and Chen, 2024). The main assumption is that price doesn't work in a random manner but there is some underlying psychology in the market and the disorderly behavior of traders. Nonetheless, technical indicators have been reported to be self-fulfilling and more susceptible to market noise when it comes to the short-term trends in the market.
Contrarily, the basic analysis is concerned with the underlying value of securities through the analysis of corporate performance, macroeconomic and industry factors. It entails the interpretation of stock variables like earnings per share, dividend yields and the interest rates to determine whether the stock is underpriced or over-priced.
Both of these approaches are questioned by theories, including the Efficient Market Hypothesis (EMH) and the Random Walk Theory (NUNES, 2025). EMH holds that whatever information they have available is already embedded in the current prices meaning that any given strategy cannot outperform the market always without taking up some extra risk. This is extended to the Random Walk Theory which posits that how price changes are will follow a stochastic process, which makes them uncertain in the future. Although both theories have an influence, they are both criticised as having oversimplified market behaviour and underestimated the human psychology.
Struggling with deadlines? Just say ‘Do My Assignment' and relax — we've got you covered!
2.2 The Rise of Machine Learning in Finance
Machine learning (ML) has been incorporated into financial predictions at a phenomenal rate with data accessibility and computer power largely on the rise. ML models are strong at revealing non-linearities in the high-dimensional data, where they dynamically adapt to the emerging information. The initial efforts used the artificial neural networks (ANNs) to predict the price trends based on the historic information like the lagged returns and the measures of volatility.
In contrast to classical econometric models, the ML algorithms do not presuppose any particular functional form and can, thereby, complex dependencies between technical indicators, macroeconomic variables, and latent features. SVMs and deep learning systems like Long Short-Term Memory (LSTM) have been shown to be effective at modelling time variations in financial time series These types of models have demonstrated strong performance in forecasting financial markets.
However, there still remains some problems. Financial data is very non stationary; correlation between variables change as a result of regime change, policy and market sentiment. On high capacity ML models, it is possible to be overfitting on historical noise instead of learning meaningful patterns. In addition, the majority of models are based on numerical inputs alone, thus omitting such qualitative inputs as investor emotion, geopolitical tension, or media tone (Jaliya, 2024). These constraints have led to a new focus of research that uses a combination of behavioural and textual data in prediction systems.
2.3 Behavioural Finance and Market Sentiment
Behavioural finance developed as an extension of the shortcomings of EMH in order to acknowledge the fact that markets are dominated by psychology as much as fundamentals. Investors are not rational actors: they are prone to biases, like overconfidence, anchoring and herd behaviour. This psychological and emotional disposition generates orderly distortions of equilibrium prices. As an example, when markets become optimistic, the summation of individual over-pricing can result in the business-wide over-pricing, whereas panics involving like-rushing to sell assets can have the opposite effect.
The tendency of the market spirit, the mood of the atmosphere of investors is a key factor here. It summarises attitudes of fear, greed or uncertainty of people. Positive sentiment normally comes in hand with the surge in markets and negative sentiment is usually indicative of regressions (Frydman, Mangee and Stillwagon, 2020).
Sentimental information must be quantified by converting qualitative psychological information into quantifiable connotations. Conventional financial models cannot effectively accomplish this, and the current development of natural language processing (NLP) makes it possible to extract tone in large bodies of text in a systematic matter. Therefore, behavioural finance and data science converged leading to sentiment-sensitive financial forecasting.
2.4 Sentiment Analysis as a Predictive Tool
Sentiment analysis (also known as opinion mining) aims to find out the emotional polarity, or a text message, such as positive, negative, or neutral. Financially, it will be used to measure market sentiment in the form of news content, earnings reports, and social media debates. The lexicon-based models were the initial sentiment models, and the methods trusted the predetermined dictionaries to describe the words as positive or negative words (Qi and Shabrina, 2023). These methods were simple and transparent although they were limited by the fact that they could not interpret context. The terms, which were not negative in terms of accounting, like the terms of liability or debt, were often incorrectly categorized as negative.
Future improvements made use of statistical and machine learning to enhance performance. Such systems as VADER came with rule-based scoring systems which supported intensifiers and negations. Nevertheless, the significant revelation was reached with the introduction of transformers-based deep learning models, in the form of BERT (Bidirectional Encoder Representations from Transformers) specifically.
As an implementation a fine-tuned version of BERT specifically designed with financial text used, FinBERT is an important improvement to the field of finance. FinBERT unlike generic sentiment models comprehends specialised vocabulary and idioms availed by markets. To give an example, it can tell the difference between the technical expression of bullish resistance (a neutral condition) and bearish outlook (a negative mood).
Sentiment analysis has many different sources of data. The institutional sentiment is captured by the financial news agencies like Bloomberg and Reuters which portrays the view of the analysts and professional investors (Du et al., 2024). On the other hand social media platforms identify the sentiment of retail investors, which can be used to affect short-term volatility. A combination of these sources will give us a more holistic picture of the market psychology. The basis of this is empirically demonstrated where negative sentiment typically is accompanied by declines in the market whereas positive sentiment is associated with short-term rallies. Sentiment analysis has thus emerged as an important complementary indicator in the current trading tactics.
2.5 The Integration of Sentiment and Machine Learning
The scores obtained by NLP models in terms of sentiment could also be considered as one of the extra explanatory variables, in addition to more conventional one, such as returns, volatility, and momentum. It is the hypothesis that sentiment gives early indications of investor response before they are completely represented in the prices.
The particular algorithms that are useful in this case include the Random Forest and the XGBoost, which exhibit an advantage of sentiment integration due to the ability to capture a non-linear, non-linearity in the relationship between affected by the emotional tone and the price changes (Demir and Şahin, 2022).
Although there are such advancements, there are still challenges. Naturally, many studies use simplified sentiment measures like the number of polarity or mean tone which are not able to capture the nuance.
The current study seeks to fill these gaps via the application of FinBERT to examine financial headlines and incorporating the sentiment features obtained in machine learning models conditioned on the data of S&P 500 (Roman, 2024)..
2.6 Conclusion of Literature Review
Stock market prediction has been evolving in a trend of an increasing trend of changing the human intuition and the fixed-point economic theory to the use of information and interdisciplinary strategies.
Behavioural finance came in to fill this gap by perceiving the role of sentiment and emotion. With the introduction of new models of NLP like FinBERT, now it is possible to quantify these behavioural factors and use them as predictive constituents.
However, shortcomings are still present. Sentimental predictive power is very contingent upon the data quality, accuracy in linguistics, and time alignment. Furthermore, causality is also uncertain, since sentiment can predict price changes, it can also reflect them.
Research Methodology
3.1 Research Philosophy and Design
The present research is based on the positivist research philosophy that focuses on objectivity of observation, quantification, and empirical testing of the hypothesis (Maksimovic and Evtimov, 2023). The paper aims at examining the possible improvement in predictability of stock market trends by incorporating financial sentiment information with the conventional market indicators, in this instance, S&P 500 index. In this regard.
The study is an experimental, comparative and quantitative research design. It compares the performance of different machine learning models on two different data setups, including the one visually learning on just classic market data and the other on financial news sentiment features.
The paper uses a deductive line of reasoning and starts with a hypothesis informed by theory based on behavioural finance that the sentiment of the market has a quantifiable influence on the movement of prices. The hypothesis is then empirically tested by constructing and testing machine learning models that are trained using large scale datasets.
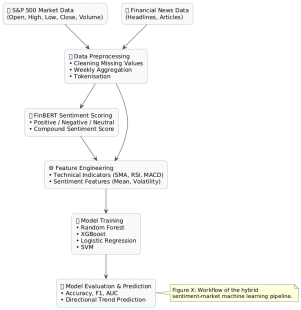
Figure 1: Workflow of the hybrid sentiment-market machine learning pipeline.
3.2 Data Collection Strategy
The study will be based on two types of data, which are market data and news-based sentiment data. These data sets are gathered, cleaned, putting them into chronological sequence and ready to be trained into machine learning structure (Noor et al., 2023).
3.2.1 Market Data
The market data will include daily historical events of S & P 500 index and its constituencies since 2010 to 2023. These fields are the following: Date, Open, High, Low, Close, Adjusted Close and Volume.
It was obtained on Yahoo Finance and validated with publicly available data sets on Kaggle which makes the data sets to be likely in terms of integrity and totality. The information was put along three tabulated files:
- sp500 index index.csv sp500.csv - daily index price movements of S&P 500;
- sp500 updated.csv — same as sp500 companies plus their tickers and industry codes.
- sp500 stocksventory.csv- historical price data of all S+P 500 component stocks.
A combination of this permits both disaggregated (firm-level) and aggregate (index-level) analysis. Additional indicators that are generated by the introduction of firm level prices include performance averages and volatility measures of the sector.
3.2.2 News and Sentiment Data
The textual data has financial news headlines that pertain to the S&P 500 and its constituents. The selected time (2010-2023) comes in line with market data, whereby the sentiment and price series are synchronized (ABDULLAHI and Kudirat Mopelola MALIK-ABDULMAJEED, 2024).
All the headlines were preprocessed and then analysed with FinBERT transformer-based natural language processing model that was specifically trained on the financial field. FinBERT generates probability distributions of three sentiment classes, namely positive, neutral and negative, based on which a compound sentiment score was obtained as:
Sentiment=P (Positive)−P(Negative)
This is a numerical figure between -1 and +1, which depicts the tone of every headline. These scores were then added at daily and weekly by comparing frequency of market data.
3.2.3 Justification for Data Sources
S&P 500 index was chosen because of the fact that it is one that represents the entire U. S. equity market, and it is highly liquid as well as widely available in both financial and textual data. It's make up is a general indicator of the macroeconomic mood (Gasparėnienė et al., 2021). The reasons behind the selection of financial news sources are their credibility and systematic way of language use that will help to extract the sentiments more accurately than the social media text.
3.3 Data Preprocessing and Feature Engineering
Any successful machine learning pipeline is based on the high-quality data preprocessing and features engineering. This step converts raw market and textual data into goods in a structured numeric form as are compatible with algorithmic modelling.
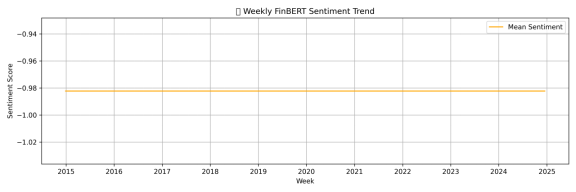
Figure 3: Plot weekly sentiment trend
3.3.1 Market Data Preprocessing
The raw market data had blank values that had non-trading days, and some cases of missing tickers. Missing data were addressed by using forward filling with the understanding that the last known data gives the fairest judgment of the next date of validity.
To calculate the returns on a daily basis, the percentage change of the adjusted close price in logarithmic terms was calculated to find that:
This transformation stabilises the variance and transforms the levels of prices into time series that are stationary to be modelled with.
- Simple Moving Averages (SMA): 5-day, 10-day, and 20-day windows;
- Exponential Moving Average (EMA)for trend responsiveness;
- Relative Strength Index (RSI)to capture overbought or oversold conditions;
- Moving Average Convergence Divergence (MACD)as a momentum oscillator; and
- Rolling Volatilitycomputed from a 14-day standard deviation of returns.
3.3.2 News Data Preprocessing
Sentiment analysis was done on textual data which has been extensively cleaned. The process included:
- Change to lower case it is regular;
- Erasing of punctuation, figures and stop words;
- In-built tokenization of FinBERT with its tokenizer that has words mapped to numbers.
FinBERT thereafter gave the likelihoods of sentiment to each headline processed. Based on these, an apparent daily score of sentiment was calculated as the aggregate rating of all scores on headlines printed on the identical day.
3.3.3 Feature Integration
The market and sentiment data were combined with the help of their respective dates. The sentiment data was averaged to equal frequencies with the market data which is on a daily or weekly basis.
The resulting final feature matrix therefore included numerical, temporal and sentiment derived features (Dilan Aksoy‐Yurdagul, 2025). A binary independent variable was formed showing direction of the impending movement of the market the next day with the code:
- 1 is increased closing price,
- 0 for a decrease.
-
3.4 Model Development and Training
The predictive models were realized in Python under the libraries with the use of the statements pandas, NumPy, scikit-learn, and transformers (Tran et al., 2021). The design, selection and training of the model are discussed in the following subsections.
3.4.1 Defining the Prediction Task
The goal of the modelling was to forecast the possibility of the S&P 500 index either rising or falling on the next day. The latter directional prediction problem can fit perfectly in the classification algorithms.
3.4.2 Model Selection
The sample of machine learning classifiers to display different interpretability and complexity was composed of four:
- Logistic Regression Simple benchmarking.
- Random Forest Classifier this is a non-linear ensemble model that is suited to high-dimensional data.
- XGBoost - a powerful boosting algorithm, which constructs decision trees, sequentially, to add complicated interactions.
- Support Vector Machine (SVM), a powerful classification algorithm that can be utilized in non-linear classification by means of kernel mapping.
The final model to be implemented was the Random Forest model because it has a balanced interpretability, computational power as well as high empirical perfectness.
3.4.3 Data Splitting and Cross-Validation
The dataset was separated into time, to prevent data leakage and achieve temporal validity:
- Training Set: 2010-2019
- Validation and Testing Set: 2020-2023
In this method, information in future will not determine what will happen in the past forecasting. A rolling window time-series split was used to perform cross-validation in which the temporal sequence of observations would be preserved.
3.4.4 Model Training and Hyperparameter Tuning
Optimisation of model parameters was done through the use of GridSearchCV, which checked model combinations of important hyper parameters namely the number of trees, the maximum depth and learning rate (Khalid Alemerien, 2024). As an example, in the Random Forest, tuning was targeted at the number of estimators, max-depth, and min-samples-split.
3.5 Model Evaluation Framework
To achieve the accuracy and robustness of a model, a complete set of metrics was used to measure the performance of each model. These metrics included:
- Accuracy:Percentage of the correctly predicted ones.
- Precision:This is the percentage of true positive predictions of all positive predictions.
- Recall (Sensitivity):It is the percentage of true positives demonstrated.
- F1-score:The mean or the arithmetical value of the precision and recall that strikes a balance between false positives and false negatives.
- AUC-ROC:The catchment region of the Receiver Operating Characteristic curve publicizing the sibling of the trade-off between the sensitivity and specificity.
The hybrid sentiment-combined model was tested straight against the baseline market-only model in these measures.
Also numerical metrics, visual diagnostic tools like learning curves, feature importance charts, and confusion matrices were used to understand model behavior (Varoquaux and Colliot, 2023).
3.6 Critical Reflection (Anticipated)
The methodological structure of the given research is both rigorous and based on empirical arguments, but some shortcomings and points which could be considered are identified.
3.6.1 Limitations
To begin with, although the FinBERT model is still quite efficient at capturing domain-specific sentiment, it is not independent (as it is limited by the representativeness of the textual dataset) (Ayush, 2024). The diversity of the investor sentiment especially that of the retail traders due to social media discussion, may not always be accurately reflected in the financial headlines. Secondly, sentiment is not always causal indeed.
The other limitation is with regard to temporal granularity. News and prices might not coincide again at the right time, such as an article news written after the close of the market could only affect the following trading.
3.6.2 Ethical and Practical Considerations
Algorithms Everything Intrinsic to the financial markets they may increase volatility or spread herd behaviour, caused by overreliance on algorithmic trading. Also, it may lead to biases (prejudice of journalistic tone or data picking) when extracting sentiment using media. Regarding the transparency and responsible interpretation of algorithmic outputs, it is thus important.
3.6.3 Future Reflection
During the last step of this project, critical reflection will also evaluate not just the model accuracy but also its interpretability, strength, and applicability in the real world (Emrullah ŞAHiN, Arslan and Durmuş Özdemir, 2024). Such scenarios as model failure, overfitting or data leakage will be examined, and methodological modifications offered. The reflection will also involve the consideration of the possibility of extrapolating the framework to include other sources of sentiment, including social media feeds, to increase the representational diversity.
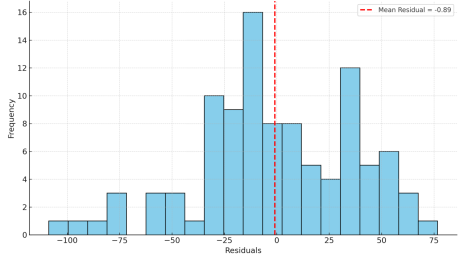
Figure 6: Distribution of model residuals.
3.7 Conclusion
Overall, this chapter has described the research philosophy, research design, data collection plan of the study, data preprocessing, model development and evaluation framework that are behind the study. The study results are systematic by quantifying the hypothesis that sentiment-aware models make better predictions S&P 500 patterns compared to purely numerical methods through FinBERT sentiment quantification and more advanced machine learning classifiers.
The results of this methodological framework should lead to the growing body of evolving research in terms of empirical and conceptual contribution to the developing discussion on hybrid predictive models in financial analytics.
Plan for Completion
4.1 Current Status of the Project
Bringing a comprehensive forward: As of this report, this forward has been accomplished to a large degree:
- The literature review is about ninety percent comprehensive.
- The S&P 500 (2010-2023) market data has been downloaded and cleaned, and the validity confirmed (Ismail Adelopo and Luo, 2025).
- There has been integration of company metadata and stock level trading data.
- The model implementation and testing of the FinBERT sentiment analysis have been done locally.
- It has developed a hybrid dataset of sentiment and market properties.
- Preliminary model testing and analyses have been effectively done with readable results and validity of the project.
4.2 Work Plan for Completion
Weeks 1-2:
Finalise the financial news data, such that it holds coverage consistency and sentiment rating across periods. FinBERT Pipe Enterprise End-to-End sentiment extraction pipeline, use daily sentiment outputs, and serialize the results in a argumentative capacity.
Weeks 3-5:
Combine the last sentiment data and technical indicators. Train all the chosen models, the Logistic Regression, Random Forest, XGBoost and SVM, with base with both datasets. Hyperparameter optimization with RandomisedSearchCV.
Weeks 6-7:
Measure end models on the test set on all the five measures of classification. Conduct a comparative and statistical analysis in order to measure the improvement in the performance due to the integration of sentiment. Produce performance visualisations and charts.
Weeks 8-10:
Write full report chapters, which entail interpretation, critical reflection, and discussion of the ethical considerations. Make sure that all visual representations (tables, graphs) are in proper format.
Weeks 11-12:
Revise based on comments of supervisors. Perform proofreading, editing, and formatting and submit it. Develop slides that give a summary of methodology, summary of findings and contributions.
4.3 Contingency Plans
Contingency 1: Underperforming Model.
In case models cannot perform better than random guessing (accuracy is about 50 per cent), then the project will switch to diagnostic consideration (Morgan et al., 2021), looking at how well the model works and its underlying assumptions and the possibility of a mismatch in time.
Contingency 2: Data Issues.
In case there are the gaps in the data, other sources will be utilized, including the GDELT Project or financial news archives to be used in Kaggle (Tharmalingam, 2024). To achieve a more comprehensive representation of behaviour, external sentiment information provided on social media can be included over part of the study duration
Uncertainty 3: Technical Uncertainty.
In the event that FinBERT is computationally prohibitive, a less heavy sentiment model (VADER) will be used, as a backup. This guarantees completeness as well as maintenance of methodological integrity.
From case studies to essays — our Law Assignment Help guides you to success!
Conclusion
This report will present the conceptual basis, empirical design and implementation plan of a combined machine learning system of predicting trends in the S and P 500 with sentiment analysis. Incorporating FinBERT-generated sentiment features and conventional market indicators, the project is able to move forward in the field of financial forecasting, suggesting that markets cannot be considered entirely efficient. It is expected that a hybrid model that will be able to encompass a quantitative and psychological aspect of the market dynamics will be developed leading to the further development of the intelligent financial analytics.
References
- ABDULLAHI, I.B. and Kudirat Mopelola MALIK-ABDULMAJEED (2024). PRICE SYNCHRONIZATION LEVEL IN THE NIGERIAN FINANCIAL MARKETS. Ilorin Journal of Finance, [online] 8(2), pp.89-99. Available at: https://ijf.org.ng/index.php/ijf/article/view/9 [Accessed 1 Nov. 2025].
- Aminimehr, A., Raoofi, A., Aminimehr, A. and Aminimehr, A. (2022). A Comprehensive Study of Market Prediction from Efficient Market Hypothesis up to Late Intelligent Market Prediction Approaches. Computational Economics, 60(2), pp.781-815. doi:https://doi.org/10.1007/s10614-022-10283-1.
- Ayush (2024). Hindi FinBERT: A Pre-trained Language Model for Financial Text Classification. Ncirl.ie. [online] doi:https://norma.ncirl.ie/7357/1/ayush.pdf.
- Demir, S. and Şahin, E.K. (2022). Liquefaction prediction with robust machine learning algorithms (SVM, RF, and XGBoost) supported by genetic algorithm-based feature selection and parameter optimization from the perspective of data processing. Environmental Earth Sciences, 81(18). doi:https://doi.org/10.1007/s12665-022-10578-4.
- Dilan Aksoy‐Yurdagul (2025). Generating Value by Working With User Communities: An Analysis of Financial Market Returns to Corporate Open Source Code Contributions. R and D Management. doi:https://doi.org/10.1111/radm.12749.
- Du, K., Xing, F., Mao, R. and Cambria, E. (2024). Financial Sentiment Analysis: Techniques and Applications. ACM Computing Surveys, 56(9). doi:https://doi.org/10.1145/3649451.
- Duz Tan, S. and Tas, O. (2020). Social Media Sentiment in International Stock Returns and Trading Activity. Journal of Behavioral Finance, 22(2), pp.1-14. doi:https://doi.org/10.1080/15427560.2020.1772261.
- Emrullah ŞAHiN, Arslan, N.N. and Durmuş Özdemir (2024). Unlocking the black box: an in-depth review on interpretability, explainability, and reliability in deep learning. Neural Computing and Applications. doi:https://doi.org/10.1007/s00521-024-10437-2.
- Frydman, R., Mangee, N. and Stillwagon, J. (2020). How Market Sentiment Drives Forecasts of Stock Returns. Journal of Behavioral Finance, pp.1-17. doi:https://doi.org/10.1080/15427560.2020.1774769.
- Gasparėnienė, L., Remeikiene, R., Sosidko, A. and Vėbraitė, V. (2021). Modelling of S&P 500 Index Price Based on U.S. Economic Indicators: Machine Learning Approach. Engineering Economics, 32(4), pp.362-375. doi:https://doi.org/10.5755/j01.ee.32.4.27985.
- Ismail Adelopo and Luo, X. (2025). Interconnectedness among cryptocurrencies and financial markets: a systematic literature review. Digital Finance. doi:https://doi.org/10.1007/s42521-025-00155-2.
- Jaliya, U. (2024). DEEP LEARNING APPROACH FOR STOCK MARKET TREND PREDICTION AND PATTERN FINDING. [online] Available at: http://gtusitecirculars.s3.amazonaws.com/uploads/Final%20Thesis%20(16)_581862.pdf.
- Khalid Alemerien (2024). Diagnosing Cardiovascular Diseases using Optimized Machine Learning Algorithms with GridSearchCV. Journal of Applied Data Sciences, [online] 5(4), pp.1539-1552. doi:https://doi.org/10.47738/jads.v5i4.280.
- Khalife, D., Jad Yammine, Bazi, T.E., Zaki, C. and Jabbour, N. (2024). Analyzing the impact of investor sentiment on S&P 500 prices using deep learning models. Journal of financial reporting & accounting. doi:https://doi.org/10.1108/jfra-06-2024-0384.
- Maksimovic, J. and Evtimov, J. (2023). POSITIVISM AND POST-POSITIVISM AS THE BASIS OF QUANTITATIVE RESEARCH IN PEDAGOGY. Research in Pedagogy, [online] 13(1), pp.208-218. Available at: https://www.ceeol.com/search/article-detail?id=1132657.
- Ming, L. and Chen, G. (2024). Stock Price Prediction Based on Relative Strength Index, Moving Average Convergence Divergence and XGBoost Model. [online] pp.1988-1993. doi:https://doi.org/10.1109/ddcls61622.2024.10606580.
- Morgan, D.J., Pineles, L., Owczarzak, J., Magder, L., Scherer, L., Brown, J.P., Pfeiffer, C., Terndrup, C., Leykum, L., Feldstein, D., Foy, A., Stevens, D., Koch, C., Masnick, M., Weisenberg, S. and Korenstein, D. (2021). Accuracy of Practitioner Estimates of Probability of Diagnosis Before and After Testing. JAMA Internal Medicine, [online] 181(6), p.747. doi:https://doi.org/10.1001/jamainternmed.2021.0269.
- Noor, H., Ahmad, J., Haider, A., Nasim, F. and Jaffar, A. (2023). A Machine Learning Sentiment Analysis Approach on News Headlines to Evaluate the Performance of the Pakistani Government. Journal of Computing & Biomedical Informatics, [online] 7(02). Available at: https://jcbi.org/index.php/Main/article/view/524.
- NUNES, R. (2025). The Efficient Market Hypothesis as an Extension of Neoclassical Theory: A Theoretical and Empirical Critique. Journal of Economics, Finance and Accounting Studies, 7(4), pp.117-134. doi:https://doi.org/10.32996/jefas.2025.7.4.10.
- Qi, Y. and Shabrina, Z. (2023). Sentiment analysis using Twitter data: a comparative application of lexicon- and machine-learning-based approach. Social Network Analysis and Mining, 13(1). doi:https://doi.org/10.1007/s13278-023-01030-x.
- Roman, K. (2024). Sentiment analysis on financial data by Large Language Models. [online] Ucu.edu.ua. Available at: https://er.ucu.edu.ua/items/f1cd1ebf-29eb-4917-a00c-5f11b504ade8.
- Saravanos, C. and Kanavos, A. (2024). Forecasting stock market volatility using social media sentiment analysis. Neural Computing and Applications. doi:https://doi.org/10.1007/s00521-024-10807-w.
- Tharmalingam, E. (2024). Extracting structured flood information for Nigeria from News Media in GDELT. Zora.uzh.ch. [online] doi:https://www.zora.uzh.ch/id/eprint/262349/1/Thesis_Tharmalingam.pdf.
- Tran, M., Panchal, S., Chauhan, V., Brahmbhatt, N., Mevawalla, A., Fraser, R. and Fowler, M. (2021). Python‐based scikit‐learn machine learning models for thermal and electrical performance prediction of high‐capacity lithium‐ion battery. International Journal of Energy Research. doi:https://doi.org/10.1002/er.7202.
- Varoquaux, G. and Colliot, O. (2023). Evaluating Machine Learning Models and Their Diagnostic Value. Neuromethods, pp.601-630. doi:https://doi.org/10.1007/978-1-0716-3195-9_20.

UPTO55%
Avail The Benefit Today!
To View this & another 50000+ free