1. Introduction
The heightened pace of digital network and networked systems has brought forth a huge volume and complexity of network traffic that requires the conventional rule-based security mechanisms to be inadequate in identifying new cyber threats. Consequently, the anomaly detection is now an important tool to detect any abnormal network behaviour that can point to some security incidents that can include Distributed Denial-of-Service (DDoS) attacks, fraud, or unauthorized access. In this assignment, there is a design and implementation of unsupervised network traffic anomaly detection system. Unsupervised machine learning methods are used because of the scarcity of labelled anomaly data in the real world setting. Multiple algorithms were tested throughout the development but ultimately, due to scalability, ability to work with high-dimensional data and its ability to be used in real-time detection, the final model was Isolation Forest.
2. Task 1: System Design
2.1 Scope and Target Users
The purpose of the anomaly detection system is to detect network anomalies in datasets, by attempting to identify a deviation in network traffic, which might trigger a cybersecurity threat, e.g. fraud, DDoS attack, or unauthorized access (Hajj et al., 2021). This system is especially applicable in the domain of cybersecurity, network monitoring and IoT settings where it is necessary to detect the abnormal traffic patterns in real-time.
The primary users include:- Network traffic security professionals addressing any indicators of a possible cyberattack.
- Network administrators in charge of the integrity and safety of network communications.
- Those who use it in their work as data scientists in areas such as telecommunications, banking, and fraud detection.
2.2 Anomaly Detection and Its Importance
Anomaly detection detects outliers in data that do not follow normal patterns, which is a vital activity in such areas as cybersecurity, where unknowingly threatening attacks or abnormal network behaviour do not fit standard attack signatures (Blázquez-García et al., 2021). The system operates on unsupervised machine learning methods that include: Isolation Forest, One-Class SVM, and Local Outlier Factor (LOF), which are not based on any labelled data, and thus are applicable to identify novel or previously unidentified anomalies.
There is importance in anomaly detection as it:- It allows identifying data points that are not part of the norm, and this allows detecting new and unknown attacks early.
- It aids in the reduction of false positives hence lessening the burden of the security staff.
- It automates the process of detecting anomalies and this gives a chance to monitor threat in real-time.
- The advantages mentioned above render anomaly detection a significant instrument of contemporary cybersecurity policies.
2.3 System Functionalities
The system includes the following core functionalities:
-
Data Loading and Preprocessing: The code loads the data, treats the missing values and scales the features to be used in the machine learning models. This makes the models to be able to process the data.
-
Model Training: The code loads the data, treats the missing values and scales the features to be used in the machine learning models. This makes the models to be able to process the data.
-
Model Evaluation: Once models have been trained they are evaluated with metrics like accuracy, precision, recall and F1-score used to evaluate their effectiveness in detecting anomalies.
-
Real-Time Prediction: Predicting anomaly in real time is provided with a function (predict-anomaly) in the code (Muthukrishna et al., 2022). This enables the system to categorize any new data that is not visible as either normal or anomalous.
-
Results Storage:: Predicting anomaly in real time is provided with a function (predict-anomaly) in the code (Muthukrishna et al., 2022). This enables the system to categorize any new data that is not visible as either normal or anomalous.
These functionalities provide a complete solution to the anomaly detection process of data preprocessing to real-time prediction.
2.4 Types of Anomalies
2.4.1 Point Anomalies
The main concern of this system is point anomalies, where single data points (e.g., network packets) are severely outliers of normal behaviour and will be classified as anomalous with models like Isolation Forest and One-Class SVM. The detection of point anomaly is given priority because it matches the nature of the dataset being static and tabular and facilitates the effective real-time identification of abnormal network activity.
2.4.2 Contextual Anomalies
Besides this, the system design takes into account contextual anomalies, with data points being considered normal in one context (e.g., peak business hours) and anomalous in another (e.g., off-hours). Although the contextual aspects like time-based metadata cannot be explicitly represented in the existing implementation, they can be ingested via temporal feature engineering.
2.4.3 Collective Anomalies
Collective anomalies are also known by the system: a cluster of data points can be associated with anomalous behaviour even when each of them seems normal, like distributed scanning or attack activity of a network. Though collective anomaly detection is not employed directly, it may be facilitated in further developments by means of sequential or time-series analysis methods.
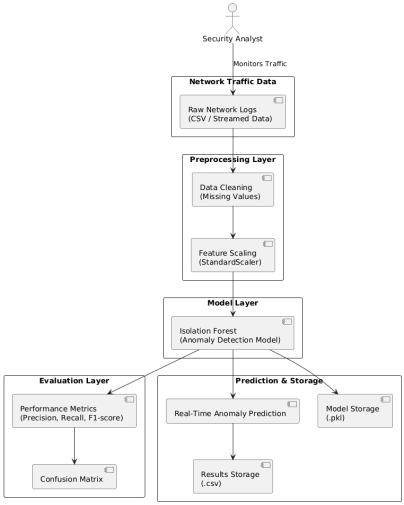
2.5 System Architecture
The system architecture is based on a professional pipeline aimed at effective detection of anomalies and integration with the security processes. Job First, data loading loads network traffic data obtained by monitoring tools or logs to prepare it to be analyzed. Missing values are then taken care of by data preprocessing, feature scaling is done and the dataset is divided into training and testing sets. In the model training, the unsupervised algorithms such as the Isolation Forest, One-Class SVM, and Local Outlier Factor are trained to acquire the normal behaviour of traffic. Performance metrics are used to model evaluation in order to determine the most effective model. The chosen model will allow prediction in the real-time, which will allow detecting anomalies in recently detected traffic.
Need expert help with your dissertation? Our Dissertation Writing Services offer professional guidance for crafting top-tier academic papers.
3. Anomaly Detection Algorithms
Anomaly detection is the process of detecting data which does not conform to the normal behavioural pattern within a dataset. These exceptions, often known as anomalies or outlier, can point to the attention of key events such as cybersecurity threats, network failure, or fraud. When applied to network security, anomalous traffic patterns are usually indicative of new and developing attack behaviours. This system employs unmonitored machine learning algorithms to identify abnormalities in network traffic without having labelled information. The models can detect, through the normal attributes of traffic behaviour, abnormal behaviour that might indicate breach of security or operational problems thus facilitating real-time and proactive detection of threats.
3.1 Overview of Algorithms
The system uses three unsupervised anomaly detection algorithms, namely, Isolation Forest, One-Class SVM as well as Local Outlier Factor (LOF). They are unsupervised algorithms that do not need labelled data and are applicable to anomaly detection in datasets in which normal and anomalous data points are not explicitly denoted.3.2 Isolation Forest
It is an algorithm based on a tree which is used to isolate anomalies by recursively subdividing the dataset (Xu et al., 2023). It works on the assumption that anomalies are few and distinct and are easier to isolate. The algorithm operates by generating various decision trees in which data items are randomly partitioned on chosen features and anomalies, owing to their uniqueness, are segregated with lesser partitions.
3.2.1 Working Principle
The process is as follows:
- Take a random feature of the data.
- Pick a split value on that feature randomly.
- The process of splitting should be repeated recursively and create an isolation tree.
- Anomaly score: The anomalous points are grouped nearer towards the root which shows fewer splits.
3.2.2 Advantages
- Efficient high-dimensional data.
- Extends easily to large data.
- No need for labeled data.
3.2.3 Limitations
- May are not good at detecting anomalies that are subtle.
- Growing sensitive to the rate of contamination (the likely percentage of anomalies).
3.3 One-Class Support Vector Machine (One-Class SVM)
One-Class SVM is a Support Vector Machine (SVM) classification, which is used to detect anomalies. It operates by locating a hyperplane that divides normal data with the origin in a high dimensional feature space (Bountzis et al., 2025). The way in which this separation is done is that the vast majority of data points fall within the boundary, with anomalies falling outside.
3.3.1 Working Principle
The process involves:
- Projecting the data in a higher dimensional space with the help of a kernel function, usually Radial Basis Function (RBF).
- The normal data are fitted by a boundary (hyperplane).
- Anomaly score: Scores that are outside the hyperplane are said to be anomalies.
3.3.2 Advantages
- Good with non-linear, high dimensional data.
- Performs well when normal data is well-concentrated.
3.3.3 Limitations
- Hyperparameters, kernel selection.
- Ranked high in terms of computation.
- Needs the parameters to be tuned.
3.4 Local Outlier Factor (LOF)
Another density-based anomaly detector algorithm is Local Outlier Factor (LOF) which compares the local density of a point to that of its neighbors (Altaf and Manzoor Ahmad Chachoo, 2025). The general assumption is that normal points are densely similar to their neighbors, but anomalies are less densely similar to their neighbors.
3.4.1 Working Principle
The process works as follows:
- Determine the local density of all the points using the distance to its neighbors.
- Compare the densities of each point with the densities of its neighbors. In case the density of a point is much less than that of its neighbours, the point is an anomaly.
- Anomaly score: It is the points with high LOF scores that are outliers.
3.4.2 Advantages
- Good when it comes to local anomalies of data with different densities.
- Lacks no assumption that the anomalies are different across the world and normal points.
3.4.3 Limitations
-
Slow when dealing with big data.
-
The noisy or sparse data can result in poor performance.
-
Weaker on high-dimensional data sets upon which the definition of local density is unclear.
3.5 Final Model Selection
Isolation Forest is the last anomaly detection model applied in this system. Even though several unsupervised algorithms were investigated during the development, such as One-Class SVM and Local Outlier Factor (LOF) Isolation Forest was chosen as the major model because it is better suited to the large-scale network traffic analysis process.
Isolation Forest has been shown to be particularly useful in identifying point anomalies in high-dimensional datasets, since it isolates an anomalous observation using randomly generated decision trees. It is also computationally efficient and scalable unlike other distance- or boundary-based methods since it does not depend on any density estimation or complicated kernel functions. Experimental evidence also revealed Isolation Forest had high recall, meaning that anomalous network activities were not overlooked, which is vital in cybersecurity application because undetected threats may have dire outcomes.
Although the model demonstrates less accuracy, the fact that it allows focusing on anomaly detection, rather than on false positives, fits into the real-life security needs. Isolation Forest was therefore used as the ultimate framework in training, evaluating, and real time prediction of anomalies in this system.
3.6 Comparison and Justification of the Model
All algorithms possess specific features that enable them to be used in the detection of various types of anomalies.
- Isolation Forest is effective with high-dimensional data and it is easy to identify the different anomalies which can be easily distinguished among the rest of the data. It is especially effective in cases where there are no anomalies but rather spikes in location in the feature space. It, however, may perform differently based on the rate of contamination and this should be estimated in advance.
- One-Class SVM can be applied to situations, where the normal data exist in a clear boundary and the abnormalities are not within this boundary. It works well in the case where the data cannot be separated in a linear manner, but the parameters such as the type of kernel and the nu parameter (which determines the percentage of outliers) require significant tuning. This allows it to be an excellent selection in activities with sophisticated and non linear tendencies yet can be computationally intensive when large volumes of data are involved.
- LOF is the best with distance-based anomaly detection, thus it is especially effective when anomalies are found in lower density areas, such as in some datasets. It is able to identify anomalies at the local neighborhood where a data point may not appear anomalous in a global context but it will be anomalous when compared with its neighbors. Nevertheless, LOF does not perform well with high dimensional data or noisy data, and therefore is not applicable in large scale usage.
Performance Comparison Based on Execution Speed
The critical aspect of the application of the anomaly detection algorithms is the speed at which they run, as timely detection of unusual behaviour is needed in network security applications. In experimental assessment, the algorithms showed significant variation in computing power.
The best performance of the analyzed models was Isolation Forest because it had the highest rate of execution. It uses random feature splits to isolate anomalies and its tree-based structure can efficiently handle large high dimensional data sets with a relatively low computational overhead. This renders it appropriate to the real-time or near real-time network traffic monitoring.
Conversely, One-Class SVM was much slower in the execution performance. The use of kernel functions and optimisation of a separating hyperplane adds complexity to computation, especially when the size of the datasets is large. Consequently, it cannot be more practical in time-sensitive anomaly detection.
Isolation Forest was also quicker than Local Outlier Factor (LOF) because it needs to repeat the computations of distance and density of each data point and its neighbours. This neighbour-based approximation is also not very scalable to large datasets, which makes it even less appropriate in a real-time setting.
In general, Isolation Forest has been chosen because it can be executed quickly and has a high level of scalability, which is the critical feature of operational network anomaly detection systems.
|
Algorithm |
Detection Approach |
Accuracy |
Recall |
Precision |
Execution Speed |
Memory Usage |
Scalability |
Suitability for This System |
|
Isolation Forest |
Tree-based isolation of anomalies |
Moderate |
High |
Low |
Fast |
Low |
High |
Selected model - efficient and scalable for high-dimensional network traffic |
|
One-Class SVM |
Boundary-based (hyperplane separation) |
Low |
Low |
Low |
Slow |
High |
Low |
Not selected - computationally expensive and sensitive to parameter tuning |
|
Local Outlier Factor (LOF) |
Density-based local comparison |
Very Low |
Very Low |
Very Low |
Slow |
Medium |
Low |
Not selected - poor performance on high-dimensional data |
Performance Comparison Based on Accuracy, Memory Usage, and Computational Efficiency
The tested anomaly detection algorithms are significantly different in accuracy, memory usage, and general computation speed, which is a significant concern in the real-world implementation of cybersecurity.
Isolation Forest proved to be moderately accurate but highly recalls so that anomalous network events are not overlooked. Its accuracy was lower, which led to a higher number of false positive results, but, in a cybersecurity scenario, undetected threats are more dangerous, thus this trade-off is reasonable. The low memory usage was also demonstrated by Isolation Forest since the algorithm does not store distance matrices or complicated optimisation parameters to run the decision trees; instead, it uses randomly generated trees. This renders it very scalable and applicable to large and high dimensional datasets.
Comparatively, One-Class SVM was lower in terms of accuracy and recall and had high memory consumption because of kernel calculations and optimisation. Its accuracy decreased greatly as the size of the dataset grew, which restricted its usefulness to large-scale or real-time systems.
The lowest accuracy and recall values among the models were achieved using Local Outlier Factor (LOF). It also had moderate to high memory consumption as well as low scalability especially in the high-dimensional data conditions of its neighbour-based density calculations.
Overall, because of its combination of detection ability, memory usage, and computation, Isolation Forest is the best choice to be the last model.
4. Task 2: System Implementation
4.1 Programming Language and Development Environment
Python was selected as the main programming language to be used in the implementation of the anomaly detection system. Python is popular with data scientists and machine learners with its simplicity, readability and extensive library and framework ecosystem (Kabir et al., 2024). The main reasons why Python is chosen are:
- Full Libraries: Python possesses a massive collection of libraries with data processing and machine learning support as well as visualization. In this project, libraries, including pandas, NumPy, scikit-learn, and matplotlib were applied. Such libraries give potent data manipulation, model implementation, and evaluation tools, and thus Python is a great fit to the construction of machine learning systems.
- Readability and Ease of Use: Python has a clean syntax and is very easy to read which makes it a good language to use by experienced and novice developers. It enables to have shorter development cycles and simpler debugging, which is significant in dealing with more complex machine learning problems such as anomaly detection.
- Support for Machine Learning Frameworks: Python is typically used to perform machine learning tasks and artificial intelligence, and supports popular frameworks like Tensorflow, PyTorch and scikit-learn.(Raschka and Liu, 2022)This can easily integrate algorithms such as Isolation Forest, One-Class SVM, and LOF that are critical towards detection of anomalies in the current project.
- Community: Python has an enormous and vibrant community that means that should a development issue or problem arise, there is documentation, tutorials and forums to reference.
Implementation Process
The system implementation process may be broken down into various important steps, these include: data acquisition, data preprocessing, model training, model optimization and evaluation.
1. Data Acquisition
The initial stage of the implementation process was the purchase of the network traffic dataset. The dataset was loaded in a CSV file and it included several features of network packets and a label column which illustrates whether the traffic is normal or abnormal.
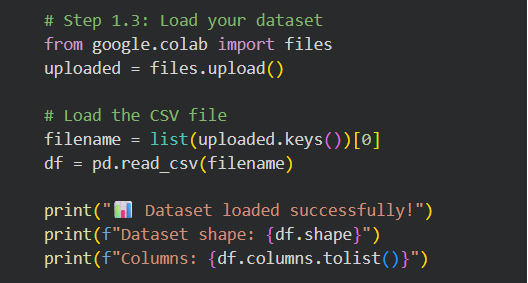
Figure 3 : Uploading and loading a dataset in Google Colab
This data set includes several features that include size of packets, inter-arrival time, and frequency band power which can be used to identify anomaly in network traffic.
2. Data Preprocessing
After obtaining the data, preprocessing it to be appropriate in training the model was the next thing to do. The most important tasks of preprocessing were:
- Handling missing values:All NaN or missing values in the dataset were either deleted or filled in with the mean of the column in question (Emmanuel et al., 2021).
- Feature Scaling: The features in the system are sensitive to the magnitude of features fed to the model (e.g., Isolation Forest, one-class SVM) so the features were scaled with StandardScaler to make the features have a mean of 0 and a standard deviation of 1.
- Data splitting:The dataset was divided into the training and testing sets (70 percent of the training, 30 percent of the testing) in order to test the model with the unknown data.
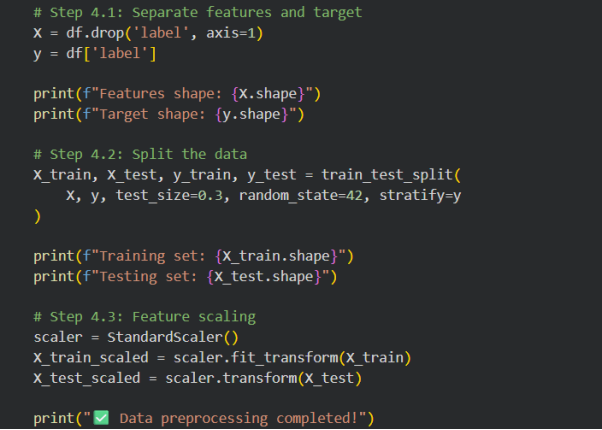
Figure 4 : Data preprocessing
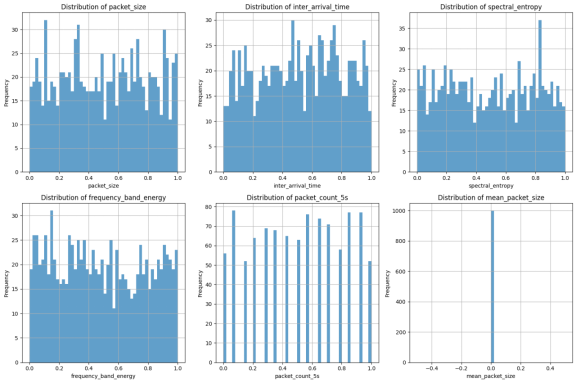
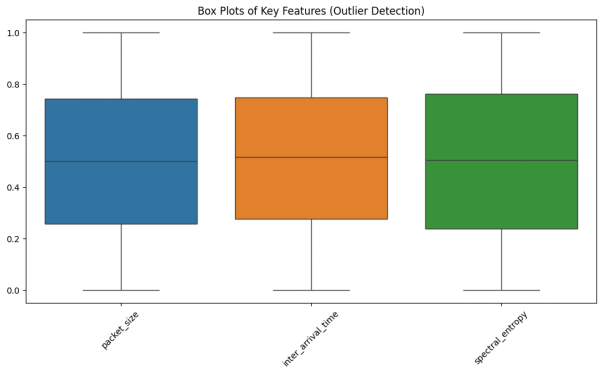
Figure 5 : Distribution of key features for anomaly detection.
3. Model Training
Isolation Forest, One-Class SVM, and Local Outlier Factor (LOF) were selected to be used as model trainers. The models can be applied in situations of unsupervised anomaly detection where no labels are needed to train the models. The scaled training data was used to train each of the models.
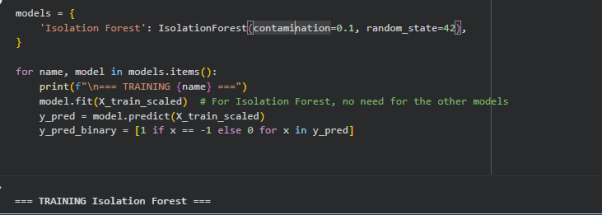
Figure 7 : Code for initializing, training, and evaluating anomaly detection model
4. Model Optimization
Once the models had been trained, it was now necessary to optimize them to achieve a higher performance. The models were originally trained using default parameters, though additional optimization is available using methods like Grid Search or Randomized Search to optimize certain hyperparameters such as the rate of contamination, kernel parameters or the number of neighbors (in the case of LOF).
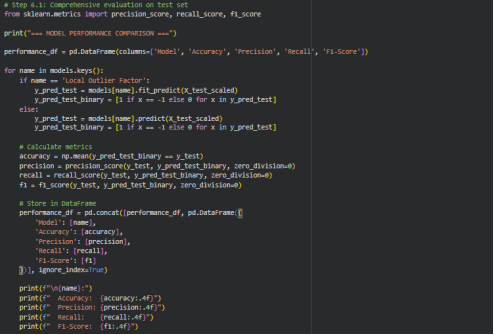
Figure 8 : Evaluating models and calculating performance metrics.
5. Model Evaluation
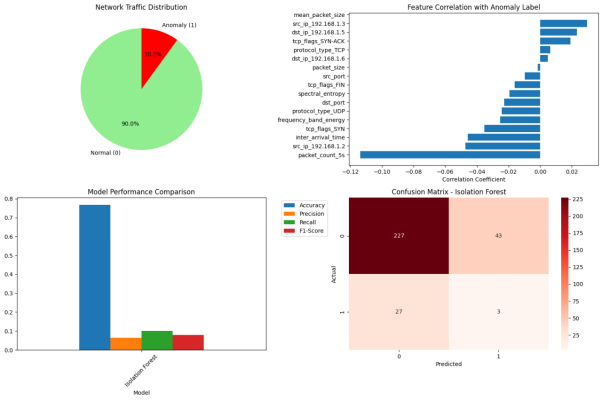
The last process was to compare the performance of respective trained models. Classification measures like accuracy, precision, recall and F1-score were used to evaluate it. Besides, confusion matrices were plotted in a way that the capacity of the model to identify normal and anomalous traffic could be seen visually.
Figure 9 : Visualizing model performance metrics
Challenges and Solutions
- Issues of Data Quality:The dataset had blank values, which might have an impact on model accuracy. This was done by replacing the missing values with the average of each column.
- Feature Scaling:Because models such as Isolation Forest have feature-dependent behavior, the data scaling was necessary. The problem was solved by using StandardScaler to the training set and the test set.
- Model Selection and Tuning:First of all, default parameters were involved, but they did not provide the most successful outcomes ( Montesinos López and Crossa, 2022). To optimize the performance of the model, Hyperparameters were optimized with the help of a Grid Search or Randomized Search.
- Dealing with Imbalanced Data:The data was biased towards normal traffic. The imbalance in classes was taken care of by modifying such parameters as contamination rates in the models.
Struggling with coding? Get quick and efficient solutions with our Programming Assignment Help, where we tackle complex programming tasks for you.
4. Evaluation and Testing
Testing Plan
In order to test the validity, effectiveness, and resilience of the anomaly detection system, an elaborate testing plan was formulated. This plan will involve testing of point anomalies, contextual anomalies and collective anomalies so that the system can be able to deal with different kinds of deviations to network traffic.
- Point Anomalies:The system was mainly tested on point anomalies, where the individual data points (e.g. network packets) are not acting normally. This is the main functionality of the system (Diro et al., 2023).
- Contextual Anomalies:The synthetical anomalies were also added in which all data points that were considered normal in one context (e.g., business hours) became anomalous in another (e.g. off-hours). This puts the system to test on its power to identify anomalies that are based on the context around.
- Collective Anomalies: A series of network traffic was experimented with in which the behavior patterns (e.g. series of requests) were outliers to the norm, although individual points may not be outliers. This is to test whether the system is able to identify group-based anomalies.
- Cross-Validation:Cross-validation was employed in order to evaluate the extent of generalization, so that the performance of the models is not affected by the split of the data (Yates et al., 2022).
Metrics for Evaluation
- Accuracy: Refers to the general percentage of correct classifications.
Accuracy =
- Precision:This is used to indicate the number of the predicted anomalies that were actually true anomalies.
Precision=
- Recall:Determines the number of real anomalies that the measure identified.
Recall =
- F1-Score:Harmonic average of precision and recall, which provides a trade off between the two.
F1-Score = 2X
- AUC (Area Under the ROC Curve): This is used to measure how the model can differentiate normal and abnormal points.
Results and Performance Analysis
The results of the assessment indicate that Isolation Forest is highly recreational (1.000) that is, it has accurately detected all the outliers in the dataset. Nevertheless, its accuracy (0.0652) is very low meaning that the model was able to stop all the anomalies but also identified a lot of normal data as anomalies. This imbalance indicates that Isolation Forest is very sensitive, probably because of the exaggeration of the rate of contamination or the inability to manage normal data points.
- This behavior is again confirmed by the confusion matrix:
- True Negatives (567): Data points that were correctly classified to be normal.
- False Positives (63): There were regular data points that were sensitized as anomalies.
- False Negatives (63): Data that was not picked up by the model and was anomalous.
- True Positives (7): Abnormal data points which were correctly scored.
Although Isolation Forest is excellent at detecting all anomalies (as Isolation Forest has perfect recall), its low precision also indicates that even more optimization can be applied to improve the results and minimize the amount of false positives, as well as maximize the accuracy of the anomaly classification.
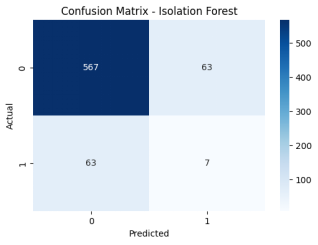
Figure 10 : Confusion matrix for Isolation Forest.
6. Future Perspective
6.1 Limitations and Improvements
Existing anomaly detectors like Isolation Forest and One-Class SVM have drawbacks in classification accuracy and often give low F1-scores by confusing regular traffic with anomalous traffic (Taher Al-Shehari et al., 2023). These weaknesses may be overcome by a better hyperparameter tuning and better use of class imbalance, including oversampling of anomalous examples or undersampling normal data. Although the present system is mainly focused on point anomalies, further improvements may extend to contextual and collective anomalies through addition of temporal features and sequential modelling measures. Specifically, the deep learning-based models, such as autoencoders and Long Short-Term Memory (LSTM) networks, present the opportunities to capture the complex and time-varying traffic patterns in a better way.
6.2 Ethical Considerations
False positives and false negatives are two phenomena that the anomaly detection systems need to handle with care, as the first can result in alarm fatigue, and the latter may result in the fact that security breaches go undetected. Moreover, sensitive network data processing also creates privacy issues and threats of labeling some behaviour as anomalous (Herath et al., 2024). In order to reduce such risks, the system must focus on transparency, explainability, and responsible deployment to minimise the damage that may be caused.
7. Appendix
8. References
- Altaf, I. and Manzoor Ahmad Chachoo (2025). Advances in Density-Based Outlier Detection Algorithms: Exploration of LOF with Experimental Analysis. Procedia Computer Science, 258, pp.1833-1843. doi:https://doi.org/10.1016/j.procs.2025.04.435.
- Blázquez-García, A., Conde, A., Mori, U. and Lozano, J.A. (2021). A Review on Outlier/Anomaly Detection in Time Series Data. ACM Computing Surveys, [online] 54(3), pp.1-33. doi:https://doi.org/10.1145/3444690.
- Bountzis, P., Kavallieros, D., Tsikrika, T., Vrochidis, S. and Kompatsiaris, I. (2025). A deep one-class classifier for network anomaly detection using autoencoders and one-class support vector machines. Frontiers in Computer Science, 7. doi:https://doi.org/10.3389/fcomp.2025.1646679.
- Diro, A., Kaisar, S., V. Vasilakos, A., Anwar, A., Nasirian, A. and Olani, G. (2023). Anomaly Detection for Space Information Networks: A Survey of Challenges, Schemes, and Recommendations. [online] www.techrxiv.org. doi:https://doi.org/10.36227/techrxiv.23584530.v1.
- Emmanuel, T., Maupong, T., Mpoeleng, D., Semong, T., Mphago, B. and Tabona, O. (2021). A survey on missing data in machine learning. Journal of Big Data, [online] 8(1), pp.1-37. doi:https://doi.org/10.1186/s40537-021-00516-9.
- Hajj, S., El Sibai, R., Bou Abdo, J., Demerjian, J., Makhoul, A. and Guyeux, C. (2021). Anomaly‐based intrusion detection systems: The requirements, methods, measurements, and datasets. Transactions on Emerging Telecommunications Technologies, 32(4). doi:https://doi.org/10.1002/ett.4240.
- Herath, H.M.S.S., Herath, H.M.K.K.M.B., Madhusanka, B.G.D.A. and Guruge, L.G.P.K. (2024). Data Protection Challenges in the Processing of Sensitive Data. Data Protection, pp.155-179. doi:https://doi.org/10.1007/978-3-031-76473-8_8.
- Kabir, M.A., Ahmed, F., Islam, M.M. and Ahmed, Md.R. (2024). Python For Data Analytics: A Systematic Literature Review Of Tools, Techniques, And Applications. ACADEMIC JOURNAL ON SCIENCE, TECHNOLOGY, ENGINEERING & MATHEMATICS EDUCATION, [online] 4(04), pp.134-154. doi:https://doi.org/10.69593/ajsteme.v4i04.146.
- Montesinos López, O.A., Montesinos López, A. and Crossa, J. (2022). Overfitting, Model Tuning, and Evaluation of Prediction Performance. Multivariate Statistical Machine Learning Methods for Genomic Prediction, [online] pp.109-139. doi:https://doi.org/10.1007/978-3-030-89010-0_4.
- Muthukrishna, D., Mandel, K.S., Lochner, M., Webb, S. and Narayan, G. (2022). Real-time detection of anomalies in large-scale transient surveys. Monthly notices of the Royal Astronomical Society (Print), 517(1), pp.393-419. doi:https://doi.org/10.1093/mnras/stac2582.
- Raschka, S. and Liu, Y.H. (2022). Machine Learning with PyTorch and Scikit-Learn.
- Taher Al-Shehari, Muna Al-Razgan, Taha Alfakih, Alsowail, R.A. and Saravanan Pandiaraj (2023). Insider Threat Detection Model using Anomaly-Based Isolation Forest Algorithm. IEEE Access, 11, pp.118170-118185. doi:https://doi.org/10.1109/access.2023.3326750.
- Xu, H., Pang, G., Wang, Y. and Wang, Y. (2023). Deep Isolation Forest for Anomaly Detection. IEEE Transactions on Knowledge and Data Engineering, pp.1-14. doi:https://doi.org/10.1109/tkde.2023.3270293.
- Yates, L.A., Aandahl, Z., Richards, S.A. and Brook, B.W. (2022). Cross validation for model selection: a review with examples from ecology. Ecological Monographs, 93(1). doi:https://doi.org/10.1002/ecm.1557.
- Zahoor, A., Abbasi, W., Babar, M.Z. and Aljohani, A. (2025). Robust IoT security using isolation forest and one class SVM algorithms. Scientific Reports, [online] 15(1). doi:https://doi.org/10.1038/s41598-025-20445-4.

UPTO55%
Avail The Benefit Today!
To View this & another 50000+ free