Introduction
In present-day scenario, the utilisation of machines and technologies have gained prominence so much so that the organisations have become heavily reliant on its mechanisms for deriving valuable insights in order to maximise their goals (Andrejevic and Gates, 2014). At its core, this field is established on the principles of statistics which cater to the needs of government and organisations alike. Data Analysis is crucial for the organisations as it facilitates prompt and hassle-free solutions to a given set of challenges that arise either on a day-to-day basis or occasionally. Today, this area has evolved in the form of Artificial or Business Intelligence as well as Machine Learning thaty is helping companies worldwide to fulfil client needs in a significant manner.
The following report aims to provide a detailed account on the terminology used in the field of Data Analytics. Additionally, the given project report also includes various analysis such as Exploratory, Predictive and Descriptive along with their application by way of employing a certain programming language or tool. Also, various issues related to data preparation, visualisation as well as assumptions regarding sampling and statistical inferences have been discussed in detail.
TASK 1
1.1 Common terminology in ‘data analytics'
Essentially, the concept of 'data analytics' can be defined as a process of collecting and examining a large pool of information so as to uncover hidden patterns which enable the business enterprises to gain valuable insights regarding organisational operations. Through this, the business manager is able to draw valuable inferences and gain insights in relation to a particular problem or situation. Since its a broad term, this area of analytics is constituent of wide array of elements. These have been explained as under:
- Population:
A pool of information which includes specific sets of variables that have similar characteristics from which a statistical sample is drawn for the purpose of analysing and gaining insights regarding a particular hypothesis (Chen, Chiang and Storey, 2012).
- Sample:
It is a set of data which is chosen from a larger pool of information, usually known as 'population', that is representative of all the variables present in such information. It can said to be a fraction of population which is chosen by a researcher for further analysis of given dataset.
- Categorical Data:
It includes a certain set of variables which are grouped in the form of multiple categories on the basis of their characteristics or features such as race, sex and age group among others. Thus, it requires the utilisation of data tables.
- Ordinal Data:
A type of quantitative, statistical as well as categorical data wherein the distance between the variables is unknown even though such data is ordered as naturally occurring class. Hence, it is usually found in the form of an order or scale (Gandomi and Haider, 2015). For instance, measuring level of happiness on a scale of 1 to 10.
- Nominal Data:
A type of data which can neither be ordered nor be measured and is usually employed for the purpose of labelling variables without giving them any actual quantitative unit of measurement. For instance, male and female is a prominent example of Nominal Data.
- Continuous Data:
A set of infinite quantitative information, except for whole numbers, which can be measured as well as subdivided in a meaningful manner. For instance, temperature, height and weight among others.
- Discrete Data:
A type of finite statistical information which includes variables in the form of integers with a possibility of categorization. Also, it is not achievable to subdivide such information meaningfully and are usually in the form of numericals (Hazen and et.al., 2014).
1.2 Critical evaluation of the use of data analytic methods
With the advent of technologies in the form of Internet of Things (IoT) as well as Integrated Communications, it is easy to retrieve information, either primary or secondary, through content which is readily available online all around the world. However, in the language of statistics, not all information retrieved is usable for the research purposes. Hence, confirmation of relevancy, reliability and authenticity of such data collected is of paramount importance. For this purpose, an organisation or investigator may utilise various analytical methods. These have been enumerated as follows:
- Descriptive Data Analytics:
This technique enables the user of information to derive meaning to raw data, collected in the form of primary or secondary content or both, by employing data aggregation and data mining methodologies. For companies, such information facilitates in giving answer to the question “What has happened?”. It describes or summarizes the collected data in a manner which enable the interpretors to achieve insights in the form of past trends, patterns or consumer behaviours which have led to the occurrence of one event or another (Kambatla and et.al., 2014). This method is mostly useful in determining historical insights such as total stock in inventory, average customer visits per year or year-on-year growth in profit. Thus, by way of this method, the investigator is able to achieve valuable perception regarding the past and formulate various strategies which may impact future outcomes or goals of any organisation in a critical manner. Some of the most common components of this analytical method include the determination of sums, averages and percent changes among others.
- Predictive Data Analytics:
This method enables the investigator to derive meaning to raw data by employing statistical models as well as forecasting technique. For companies, such information helps in answering the question “What could happen?”. Additionally, businesses employing such analytical methodology are able to achieve actionable insights based on collected data. This is due to the fact that such information is mostly predictive in nature which helps in the ascertainment of estimates about the likelihood of a given future outcome. Through the utilisation of such a tool, the organisations are able to consider any unforeseen event which may have been neglected previously on the part of the management. Usually, this technique employs ERP, CRM, HR and POS System related data which has been stored in organisation's database over the years (Kankanhalli and et.al., 2016). Using this historical information, statistical tools and algorithms are executed which help in deriving meaningful relationships between variables taken into consideration. One of the most common application of this tool is to forecast demand for inputs or customer behaviour and purchasing patter or even identification of trends in turnover related activities.
- Prescriptive Data Analytics:
This method enables the investigator to derive meaning to a given set of accumulated raw data by employing optimization, business rules, machine learning, computational modelling procedures as well as simulation algorithms. Relatively, it is a new field of data analytics which has gained immense prominence in the recent years. For companies, such information helps in answering the question “What should we do?”. As the name suggests, this technique is largely related to the advisory side of analysis. Additionally, businesses employing such analytical methodology are able to achieve valuable learnings in regards to future outcomes. This is due to the fact that Predictive Data Analytics utilises a given set of information and enables a business manager to understand key impact of future decisions in a quantitative manner. Through the utilisation of such a tool, the organisations are not only able to predict but also get recommendations regarding a particular strategic business decision. Apart from this, this analysis also helps in showing the correct plan of action which must be taken by the business manager in order to achieve the recommended pathway (Kotu and Deshpande, 2014). One of the most common application of this tool among various business enterprises is to optimise different units constituting the supply chain. These may include scheduling, production and inventory.
1.3 Summarising the importance of data analytics for businesses
In current times, importance of data analytics cannot be regarded as something of trivial nature. This is due to the fact that organisations have become complex structures that require implementation of management policies or procedures by exercising proper control over all managerial functions. For this purpose, an enterprise may adopt the Exploratory Data Analysis (EDA) methodology that consists of a variety of techniques. One can say that it is a philosophy rather than a mere tool which helps in achievement of manner in which data analysis must be carried out by a particular business. Through its implementation, the businesses are able to achieve the following goals:
- Variable Identification;
- Detection and treatment of Errors and Omissions or Missing Values;
- Appropriate selection of analytical models suitable for a particular business;
- Determination of explanatory variables and their relationship with outcome variables.
Exploratory Data Analysis may be classified on the basis of graphical and non-graphical methods as well as univariate and bivariate analysis. This relationship has been depicted below:
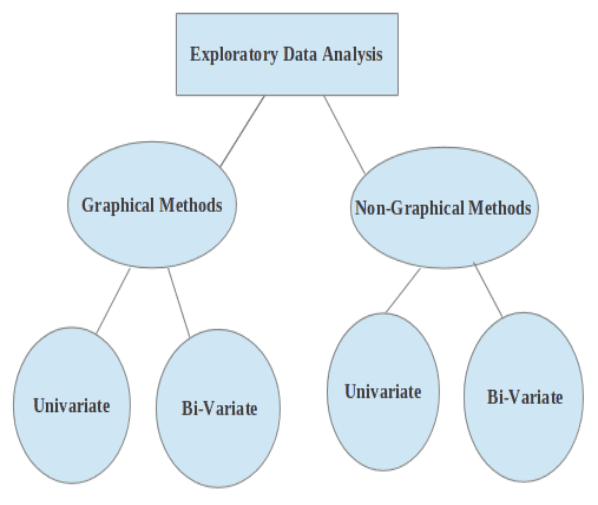
(Source: Types of EDA, 2019)
The Graphical Methods employ the summarisation of data in a diagrammatic manner whereas under Non-Graphical the data is presented in the form of summary statistics (Manoochehri, 2013). On the other hand, Univariate Analysis includes scrutinizing a single variable at a time and vice versa. It is usually recommended to execute a Univariate EDA Analysis before performing a Bi-variate or Multi-variate investigation for a given set of variables.
In a nutshell, one can state that Exploratory Data Analysis helps in simplifying the presentation of numeric information in an attractive and easily communicative manner. This is mainly due to the fact that managers does not have time for looking at each and every variable or table. Through the implementation of EDA, in the context of current business scenario, organisations have been able to achieve faster and reliable communication of important information that aid in making informed strategic decisions in the enterprise. Thus, Data Analytics plays an important role in the success of an organisation.
TASK 2
2.1. Evaluate analytical model data preparation processes
As the name suggests, Data Preparation relates to those procedures or actions that help in prompt conversion of raw data into an easily understandable, accessible as well as analysable piece of information. It is the first step among different Data Analytics Projects undertaken by organisations all around the world. Hence, Data preparation process includes those activities which enable in the collection, cleaning as well as summarisation of data into a single fragment or piece of information which is mainly useful for analytical purposes (Michael and Miller, 2013).
There are many stages to this process which includes determination of data requirement along with collection, processing, discretization, reduction and aggregation of data in a meticulous manner.It is important to note that processing may include employing of semi-structured or unstructured metadata processing which involves provisioning of information regarding other data. On the other hand, discretization includes conversion of continuous data attributes into a finite set of intervals while preventing loss of information simultaneously. Once these are carried out, data is then reduced in a simplified and ordered form which is eventually aggregated to give a wholesome perspective regarding a particular situation in an effective manner.
For analytical purposes, the data may be presented in the form of graphical or non-graphical manner. For this purpose, employment of different types of Exploratory Data Analysis (EDA) is ideal for the organisation. One can say that through the application of EDA, Data Visualisation ecomes more effective yet simplified. Thus, acting as an important analytical tool that forms a crucial part of the overall Data Preparation Process. While implementing this analytical tool, the data preparation process would include utilisation of various methodologies such as Descriptive Statistics, Inferential Statistics, Statistical Graphics, Plots, Data Analysis, Infographics and Data Science. Through their employment, visualisation of inferences drawn as well as data prepared for the purpose of achieving such inferences is fulfilled in an effective and efficie

UPTO55%
Avail The Benefit Today!
To View this & another 50000+ free