Introduction
The project report is all about the topic of business decision making which is a term described as a course of action specifically selected from various alternatives to achieve their organizational goals and targets. Under this report as a representative of students in the UK College of Business I have to design a plan by doing a survey by collecting data from various sources and on the basis of this QAA team will review the college (Ariely and Berns, 2010). Basically whole business depends upon the effective decision of an entrepreneur which means decision-making is a very critical part and continuous for the business activities.
Mainly business decision-making is all about the collection of appropriate data either from secondary or primary which act as very helpful in judgement decision-making process. In other words, enterprise decision-making explains all the necessary factors whatever is required while making useful decisions for the amended enterprise. In addition, a perfect and appropriate plan must required for the organization just to make correct decisions with the help of various graphs, and pie-charts and by using various useful data or information in business decision-making. So business decision-making is all about making a useful decision for the organization.
Under this product report, there are various tasks that are discussed, which are associated with functional aspects of business decision-making regarding UKCBC. In the First task, survey research is conducted from sources of data collection about UKCBC to know reviews of students and staff about their satisfaction. The nest part covers, various athematic calculations to know the mean median and mode through using graphs. At the end of the report, NPV and Critical path are explained to know the minimum time needed to complete a project.
TASK 1
1.1 Data Collection From Students Across All Campus
Planning is a term by which an administration can easily meet their organization's objectives by making effective decisions to avoid various future mistakes and errors which may occur during the planning period (Casadesus-Masanell and Ricart, 2011). Primary and secondary data are the various sources by which an organization can easily collect relevant data and information regarding the college facility and other issues.
Primary data are also known as first-hand information which means the information collected by the researcher itself and it is also known as real real-time data. In fact these data are based on personal experiences and observations to get accurate results.
secondary data are known as second-hand data collected by other persons for the use of businesses to make effective decisions. Secondary data can save the time of an organization because they are already found by another member for example literature, evidence, social sciences or any past records.
To develop research questions that are well structured:
- Too Narrow: under this questions can be answered with just Yes or No.
- Unfocused and too broad: this is too broad that research would be hard to discuss in a paper (Chang, Van Witteloostuijn and Eden, 2010).
- To Objectives: under this, all data collected but not lend itself to collecting information which can be used for valid arguments.
- Too simple: The information can be obtained without a need to collect unique data.
Principles of research questions :
1. Genuine: The questions are based on real investigation and deliberation.
2. Promise insight: It is based on knowledge and perspective or insight which has been already asked and answered.
From the above-mentioned sources, primary data is useful for our survey because it will provide fresh ideas and views about their college. The research is based on context if information is relevant through primary sources.
While secondary sources are just too easy because data are already available about UKCBC. so primary data is used in this research and by using short, and open-ended questions is being asked of various students and youngsters. Normal survey questions are being asked in this research.
The information sources are campuses of UKCBC colleges about its CSR, Tourism and social care regarding their students.
Need to Consult Directly With Our Experts?
Contact Us1.2 Survey Methodology And Sampling Framework Use
“Survey is all about the student satisfaction and experience that they are getting from the UK of business and computing. Regarding their views and perception, we have to plan and design a report by using the various research methodologies and frame”.
Research methodology is the term which means to find relevant information by adopting various effective strategy to attain their goals. Basically research methodology explicitly the overall advantages and disadvantages applied in the above data collection plan (Gigerenzer and Gaissmaier, 2011). In fact sampling is one of the very effective and useful techniques applied by the organization to sew useful information to make use of them in the business.
A sampling frame is a statement or is a source by which an enterprise can select appropriate alternatives from a large one which means a sampling frame is a method of sudden selection from various data. It is of two types :
- Qualitative Sampling: To identify the participants from the college to seek some information or issues.
- Quantitative sampling: It is based on errors, Generalization and the representation of the population size to get results.
In fact with the help of a sampling method, an organization can easily gather qualitative and quantitative data according to the requirements of the business process. However, this means survey primarily shows all the essential techniques and methods which is useful while making plans by considering all the factors like consumer satisfaction, preferences, attitudes and behaviour towards the college as well as the facilities they are getting from it (Ho, Xu and Dey, 2010).
Research methodologies are used to study the implications of uniform action through conducting research at UKCBC College. It helps to contextualize its findings within the large body of research. The set goal of analysing surveys regarding the satisfaction and experiences of their students is being easily evaluated. The key to research relies on iteration. It will be helpful in the revision and improvement of research with new ideas and innovation.
The main use of the sampling framework is to use the qualitative and quantitative data properly. Make sampling from various numerical information and on that basis provide ranking to the most appropriate techniques. It is mostly conducted through Questionnaires, taking face to face interviews, or by observing their responses towards asked questions.
1.3 Design A Questionnaire For Collecting Data
- Survey: About the student satisfaction and Experience From their College
- Name of the students :
- Faculty :
- Age:
- Age group: From 18 to 45
- Years:
Q.1 On which campus of UKCBC you are?
(a). Park Royal campus
(b). Crickewood campus
(c). Lords House campus
(d). Oxford Street campus
Q.2 Which course are you attending?
(a). Business management
(b). Travel and tourism
(c). Social care
(d). IT technology
(e). Accountant
Q.3 Does the security structure great on the grounds?
(a). Excellent
(b). Good
(c). Below desire
Q.4 Was the environment clean and easy?
(a). Most likely
(b). likely
(c). Dis likely
(d). No Comment
Q.5 What is best in UKCBC College?
(a). Studying environment
(b). cooperative staff
(c). classroom
Q.6 Canteen comforts provided by college administration is?
(a). Hygienic
(b). Unhygienic
Q.7 Protection facilities provided by the college administration to their students?
(a). Extremely satisfied
(b). Satisfied
(c). Not satisfied
Q.8 What is your level of satisfaction with the college?
(a). Satisfactory
(b). Dissatisfactory
(c). Other
Q.9 Does the Behaviour of the Faculties are good?
(a). Yes
(b). No
Q.10 Whether the College Negotiating the issues of students?
(a). Yes
(b). No
(c). No Comment
Q.11 Is any Raging done in the college?
(a). Yes
(b). No
Q.12 Does experience from this college will help you?
(a). Yes
(b). No
(c). Can't say
Q.13 How can you improve your UKCBC college performance?
Ans..............................................................................................
…................................................................................................
…................................................................................................
Q.14 Feel free to provide additional comments or feedback.
Ans...............................................................................................
…..................................................................................................
…....................................................................................................
….....................................................................................................
Thank you for your valuable time to complete this questionnaire.
TASK 2
2.1 Summarising The Data Collected By Using Representative Values
| Year | No. of students | Satisfied students |
| 2011 | 3515 | 2284 |
| 2012 | 4112 | 2673 |
| 2013 | 4817 | 3128 |
| 2014 | 5630 | 3659 |
| 2015 | 6587 | 4281 |
| 2016 | 7706 | 5009 |
From the above figures, it has been analysed that in the year 2011, there were no. of students selected in the UKCBBC and 2284 were the students who were fully satisfied with the college institutions and their business office which they have been given to the scholar (Kahneman, Lovallo and Sibony, 2011). In 2012, number of students signed up in the school was enlarged as they ended up to 4112, and the fulfilled scrutiny among them was 2673. In 2013, the balance was changed as more students enlisted and their big part was expanded to 4817 and the number of students who were satisfied likewise increased. A similar situation has reliably gone till 2016. form the above data, it is determined that the UKCBBC has become one of the top colleges which is growing every year with a large number of satisfied students.
Mean Calculation :
Total Number of students/Number of years
=32367/6
=5394
Median calculation:
The middle value of the digit /2
=4817+5630/2
=10447/2 =5223
Mode calculation :
= NO Values because of less repetitions.
Standard deviation: 1851
The coefficient of correlation is 1.
2.2 Analyses of The Result And Conclusion
On the basis of the above data collection by felling the questionnaire from the number of students and college faculties we have analysed that UKCBBC is one of the great colleges in the UK which is delivering better facilities and results to the economy and the satisfaction to students (Li, 2010). This led to regular admission of students in the past years till the current situation. The mean of the data is 5392 which is the average collection of the students from the continuous admission in the year. The median of the survey is 5223 which is again the situation of middle-year capacity of students. The mode value is recorded as Nil because there are differences in the figure of the data collection.
As we have seen in this data collection from the various year performances the no of students is increasing on a regular basis which means that the college is good enough to satisfy the needs and provide sufficient information and valuable knowledge to the students (McGrath, 2010). The data is also indicating that satisfied students from the facilities of the colleges and environment.
Logical thinking says that one of the finest colleges delivers healthy outcomes to the students and is also free from any kind of issues and grievances between the students and faculty members. Consequently, these all are the values which have been utilized for framing the decisions of the company. With the resource of delegate choice, the organization could be ready to make the decisions for the powerful moving of the organization.
2.3 Analysis Through Measure Of Dispersion
Dispersion: It refers to the statistical collection of the portfolio return. It is the variation of different members and students of a population. It can be said that the process of distribution of ideas over huge areas (Pettigrew, 2014).
Types of dispersion
1. Relative measure of dispersion: as we have found out the absolute measure has failed to compare the total amount of dispersion. It helps to measure two or more than two sets of observations through this dispersion.
2. Absolute measure of dispersion: under this, there will be the same units as it in the original observation. If it is in kg then the observation is also in kg. It is mainly used in mean, range, standard deviation and quartile deviation.
Measures of central tendency do not give the perfect data keeping in mind the end goal to make the research methodology satisfactory (Schaltegger and Burritt,2010). That is the reason, why the measure of dispersion is utilized to draw a substantial and productive conclusion. Measures of dispersion contain standard deviation, quartiles, percentiles, skewness, range etc. as this is the actual tool which is most effective for making a productive conclusion.
Under the given case, the standard deviation is the instrument through which the risk can be determined. Here, the standard deviation is 1851.
The coefficient of correlation is one of the techniques of measure of dispersion which demonstrates the connection between an aggregate number of students and the aggregate number of fulfilled students. Here, under the given circumstance, the coefficient of correlation is 1 which shows the ideal connection between an aggregate number of students and the aggregate number of fulfilled students.

Stuck with your Assignment?
Hire our PROFESSIONAL ASSIGNMENT WRITERS and Get 100% Original Document on any Topic to Secure A+ Grade
Get Assignment Help
2.4 Quartile, Percentiles And The Correlation Coefficient Can Be Helpful
Quartile: It refers to the type of quantile. Under this, each of the groups is divided according to the distribution of particular variables or segments. Quartiles are utilised to compute the variance between the specific segments ( Binns and Tushman, 2010). Quartiles are of three sorts i.e. to begin with quartiles, second quartiles and third quartiles. To start with quartiles display the 1/25th estimation of the component, the second shows 50th qualities the third quartile shows 75th regard and the last quartile shows the 100% estimation of the part.
Percentile: It is a measure which is used in statistical values below a given percentage of various observations in a particular group of categories. Each of the 100 groups under which population is divided as per the values of the variables. As we judged according to the situation the 20th percentile is the value beneath which 20% of the observations may rely on.
The coefficient of correlation can be the number which is quantified as a correlation between two or more values in the observations. Under this the value of r =1 means perfect positive correlation and if the value of r=-1 that stats that perfect negative relation. Knowing the reaction of the student to their college is an important method which can provide correct ideas about their experiences and thoughts towards their college. So as per my analysis, they have to go for the correlation techniques ( Trevinyo-Rodríguez and Velamuri, 2010).
TASK 3
3.1 Using The Different Charts And Graphs
Bar chart
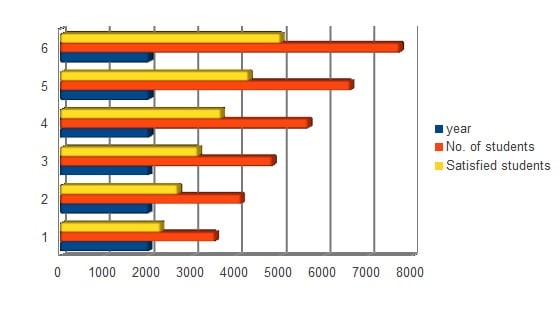
The Bar graph shows the total number of students that are enrolled in the various year. The yellow is the total satisfied number of students from the college who want to communicated with each other to take part and the admission to college (Turban, Sharda and Delen, 2011). The red line shows the total number of students during 2016 it is more as compared to 2011.
Pie chart
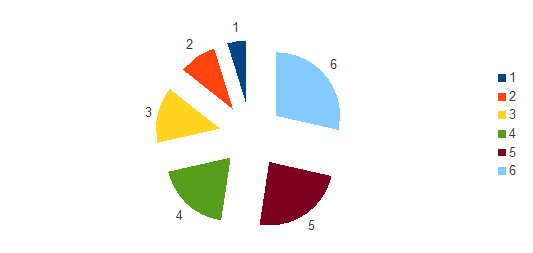
These pie charts indicate the total number of enrolments that have been done the different years. As in 4,5 and 6 there are not many differences because there is continuous admission has recorded in the survey from the last various years. There is a minimum enrollee in 2011. as compared to the other colleges (Tzeng and Huang, 2011). The student perception towards the college was also commendable because all the reports can be made on the basis of the information provided by the students about their college UKCBBC.
3.2 Trend Line Charts From The Spreadsheets
Line chart: It refers to the line which indicates the tendency of something like its student capacity and their observation and behaviour (Vercellis, 2011). It is a kind of geographical property or set of various points in a single graph. It represents the attitude and behaviour of the students of the UKCBBC colleges toward satisfaction as data is taken to determine a certain reaction from this pattern.
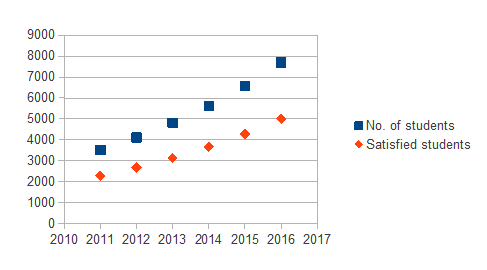
The line chart explains the total number of students at the upper side of the efficient frontier and the lower segment of the graphs shows the satisfied students from their college from 2011 to 2015. The but from this graph the no. of students are higher than the satisfied students. it is a continuous increase from 2014 to 2016 (Wu and Pagell, 2011). That is going away as the year progresses. As per this trend line chart, it is observed that the UKCBBC have a grow pattern which reflects the large impact for the innovative students who are conjectured to take affirmation in the said college. Eventually, this is an extraordinary sign. This is basically used as a bit of share market and other affiliations like trade energy. The trend line is utilized as a part of each relationship to handle their favourable position and losses (Yager and Kacprzyk, 2012).
3.3 Report to the QAA Committee
Survey Report on the Student experience and satisfaction towards their college
To,
QAA committee
19th May 2017
The survey was conducted at the UK College of Business and Computing (UKCBC). It was found that there were around 1500 students in the college. These students were from class 12th to the final year (Zikmund and et., al. 2013). The educational backgrounds of all the students were different. Some students were from arts background, some from science and commerce. The research was conducted in various locations such as London, Manchester, Glasgow Bristol and other locations in the UK. The objective of this report is to know whether the students are satisfied with their streams or college.
There are some limitations to this survey that only limited students are responsive because they have to go to their classes. Another thing is the survey is limited to certain rules of the colleges. It was found that 55 % of students were highly satisfied with their stream, 30% of students were moderately satisfied, 10% of students were not satisfied, and 5% of students were highly dissatisfied (Zsambok and Klein, 2014). There were many suggestions given by the students to improve the facilities in the college related to the canteen and classroom or the locality. Most of the students suggested changing the governance of the college and the behaviour of the faculty toward the students. There are various other recommendations have been given to the student satisfaction toward the teaching quality, attitude and style of the faculty and other staff. The are main issues which can be suggested to overcome like environment-friendly, advanced facilities for the male and female and various department of colleges.
Yours sincerely
Hemant Kumar
Lead Student Representation
UKCBBC
TASK 4
4.1 Information System Used at Different Levels
All business organisation requires information for various purposes:
1. Planning for the future (Maxwell, Jeffrey and Lévesque, 2011).
2. Controlling the activities
3. For the recording of the daily transactions.
4. To measure the performance of the employees in the organisation regarding their work performance.
5. The last thing is about the decision-making.
A management information system is a useful system to manage the efficiency of the organisation effectively. These are a combination of the plans and procedures based on designed form, organisation structure and persons who are well enough to control the administration by using resources. The outcome of this will categorised into two parts :
- Routine reports or detail transaction documents are required to adjust business practices.
- MIS is the form of summaries of the data which has been processed like labour, sales or stock analyses (Milovic and Milovic, 2012).
Advantages of this system :
most of the economy from banking to retailing, manufacturing to defence totally rely on the modern information system which well helps them to calculate and maintain the relevant information about their company.
- Speed: As the computers are dealing with repetitive processes of various transactions the system should be fast to produce the results.
- Accuracy: The data and the information generated from the computer are accurate enough so that mistakes can be minimised.
- Volume: They can work for 24 hours because they handle a vast number of data at one time.
- Complexity: The human beings are become more relaxed after the innovation of the computer because all the works are done by just one click.
Management structure and information required at the different levels of the department
The level of decision-making can be required to support the main three levels of the organisations which are: strategic, tactical and operational
information system must be designed in a way that meets the needs of these three levels:
- Strategic Level: Under this level, the information is required from internal and external sources in order to correct and plan the future strategies of the organisation. It is usually in the summarised form on an ad-hoc basis.
- Tactical level: This management level requires orders and instruction from the strategic level all together. With the routine and regular quantified information from the lower level of the department (Muindi, 2011). it is also in summarised form but detailed enough to allow tactical planning.
- Operational level: this level of management requires information and guidelines from the tactical level. It is mostly concerned with the day-to-day performance of tasks and mostly related to internal sources.
Decision Support System (DSS)
It provides information to the senior management so that they can take effectual decisions in their business. It is for the analytical work. It provides assistance to the strategic management stick and senior persons so that they can formulate their strategy according to the information.
Officer Automation System (OAS)
It raises the ratio of the employees of the organisation. It provides aid to employees and reduces the paperwork. For example- the computer software Microsoft Office XP, it provides helps to the employees to work from home and it reduces the paperwork.
4.2 Project Plan Through Activity By Determining Critical Path
| ID | Active | Task Mode | Name | Duration | Start | Finish | Predecessors | Outline Level |
| 1 | Yes | Manually Scheduled | A | 2 days | 5/19/17 8:00 AM | 5/22/17 5:00 PM | 1 | |
| 2 | Yes | Manually Scheduled | B | 4 days | 5/23/17 8:00 AM | 5/26/17 5:00 PM | 1 | 1 |
| 3 | Yes | Manually Scheduled | C | 6 days | 5/29/17 8:00 AM | 6/5/17 5:00 PM | 2 | 1 |
| 4 | Yes | Manually Scheduled | D | 3 days | 5/23/17 8:00 AM | 5/25/17 5:00 PM | 1 | 1 |
| 5 | Yes | Manually Scheduled | E | 6 days | 5/29/17 8:00 AM | 6/5/17 5:00 PM | 2 | 1 |
| 6 | Yes | Manually Scheduled | F | 1 day | 6/6/17 8:00 AM | 6/6/17 5:00 PM | 5 | 1 |
| 7 | Yes | Manually Scheduled | G | 3 days | 6/6/17 8:00 AM | 6/8/17 5:00 PM | 3,4 | 1 |
| 8 | Yes | Manually Scheduled | H | 2 days | 6/9/17 8:00 AM | 6/12/17 5:00 PM | 6,7 | 1 |
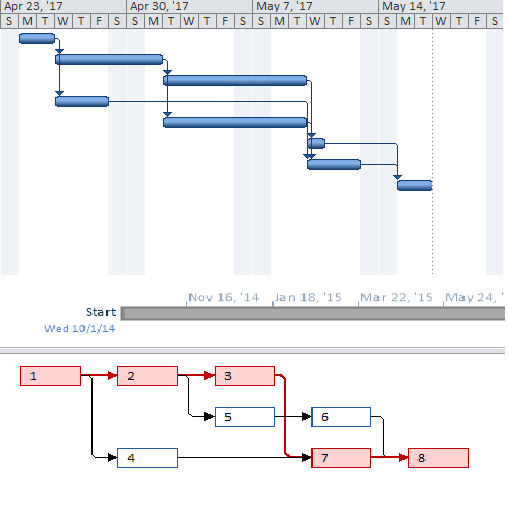
Critical path: 1-2-3-7-8
; 2+4+6+3+2
= 17 days.
As per the abovementioned critical path of various durations. It has been interpreted that the fastest path is 1-2-3-7-8 =21 days but it takes a lot of time to do the activities. The next path would be 2-4-6-3-2 =17 days. According to this path, the time duration taken for the activities is less than the earlier one (Nielsen, and Nielsen, 2011). So as per the suggestion the most favourable path would be the second one. The activity is designed in such a manner that only two possible paths can be designed. But the result can be generated through that option which takes less time.
4.3 By Using The Data Of Cash Flow For The Decision Making
Financial tools are the various effective planning and strategies which may be required while the decision-making process it means that decision-making is a very broad concept in the organization which requires lots of expertise and skills to make any big decision in an enterprise. So to make useful decisions appropriate tools are used by leaders or researchers while the decision process. In fact in travel and tourism, these tools act as a very important part because of their advantages and benefits as it require while decision process (Smith, 2010).
CASH FLOW ANALYSIS
| year | cash flows | PV factor@10% | Net cash flow |
| 0 | -15000 | 1 | -15000 |
| 1 | 8000 | 0.909 | 7272 |
| 2 | 10000 | 0.826 | 8260 |
| 3 | 5000 | 0.751 | 3755 |
| 4 | 5000 | 0.683 | 3415 |
| Total | 7702 |
As per the above estimation report, the association contribute 15000, and in the succeeding years project can make the Net Present Value is 7702 (Cash Flow,2017). it reveals that by contributing 15000, the association can make the net additional inflow of 7702 subsequently, the affiliation's wander should be recognized as it addresses the positive sign in the project.
In the given case, The internal rate of return of the association is 35% (Sosna, 2010). In this way, it has been revealed that the net income of the association is zero when the organisation's loan cost is 35%. In the event that, that the association's advance cost is 35% then, the net present estimation of cash inflow is comparable to the present estimation of cash outflow. Now of condition, the net present estimation of the firm is zero.
Conclusion
As per the above report, it has been found that the UK CBBC college is required to make efficient decisions. Here, in this scenario, it is found that, before making decisions in the institution, it is required to gather the information seriously. Under this project, various calculation is done like mean, median, and mode, and the critical path is also being analysed to know the time required for the activities. The last part of the report contains the cash flow statement and the internal rate of return that the organisation getting for the company.
References
- Ariely, D and Berns, G.S., 2010. Neuromarketing: the hope and hype of neuroimaging in business. Nature Reviews Neuroscience.
- Casadesus-Masanell, R and Ricart, J.E., 2011. How to design a winning business model. Harvard Business Review.
- Chang, S.J., Van Witteloostuijn, A and Eden, L., 2010. From the editors: Common method variance in international business research. Journal of International Business Studies.
- Gigerenzer, G and Gaissmaier, W., 2011. Heuristic decision-making. Annual review of psychology.
- Ho, W., Xu, X and Dey, P.K., 2010. Multi-criteria decision-making approaches for supplier evaluation and selection: A literature review. European Journal of Operational Research.
- Kahneman, D., Lovallo, D and Sibony, O., 2011. Before you make that big decision. Harvard Business Review.
You May Also Like
Role of KPI and Balanced Scorecard in business decision making
An insight into the business decision-making process for growth

UPTO55%
Avail The Benefit Today!
To View this & another 50000+ free