1. Introduction
1.1 Current Issues and Background
In the past decades, the United Kingdom economy was highly unstable because of global and nation-specific processes that significantly influenced the financial markets (Ibrahimov et al., 2025). Some examples of structural shocks that altered the correlation between macroeconomic variables and stock returns are the 2008 global financial crisis, the 2016 Brexit referendum, and the 2020 COVID-19 pandemic (Ohakwe and Wu, 2025). Some of the macroeconomics variables that play a crucial role in the performance of a stock market include inflation, interest rates, money supply, exchange rates, and industrial production (Collin, 2024). These factors influence investor mood and corporate profits and the effects in different industries differ. As a defensive industry, the healthcare sector is an industry with stable demand, even during economic crises owing to necessity (Jagric et al., 2021). On the other hand, the industrial sector is an extremely cyclical sector whose performance is highly dependent on the economic cycles and output in manufacture and trade (Hutton, 2021). This deterioration within the industry is the evidence of the need to realize the variation in the influence of the macroeconomic variable in the stocks returns under the conditions of the economic shock in the long run. These forces matter especially in the more uncertain economic environment in which investors and policy makers are currently operating (Downey, 2024).
1.2 Research Gap and Contribution
The high volume of papers founded on aggregate market indices, such as the FTSE 100, has provided a generalized and broad-based perspective, which has been mostly neglected in the literature on the relationship between the macroeconomic variable and the stock return (Neifar, 2022). However, such an approach does not consider the heterogeneity within the sectors, which is necessary owing to the economic particularity of defensive and cyclical sectors in the UK (Verma and Bansal, 2021). Research such as that of Peiro (2016) and Camilleri et al. (2019) has identified macroeconomic factors on stock markets, but they seldom focus on sectoral variations within a single economy, in this case, the UK. This study addresses this gap by conducting a time-series analysis of the healthcare and industrial sectors, incorporating structural breaks to capture the effects of major events like Brexit and COVID-19 (Karavias et al., 2022). Its academic contribution lies in providing granular insights into sectoral responses to macroeconomic shocks, enhancing the theoretical understanding of stock market dynamics. Additionally, the findings offer practical value for policy design, enabling targeted interventions to stabilize sector-specific economic activity, and for portfolio allocation strategies in volatile markets (Zhou et al., 2020).
1.3 Research Question and Hypotheses
This study seeks to answer the following research question: How do key macroeconomic indicators—specifically inflation, interest rates, money supply, exchange rates, and industrial production—affect monthly stock returns in the UK healthcare and industrial sectors from 1999 to 2023? Based on the literature and sectoral characteristics, two hypotheses are proposed. Hypothesis 1 (H1) posits that macroeconomic variables exert stronger negative effects on industrial sector returns, given its cyclical nature, compared to the defensive healthcare sector (Dhingra and Kapil, 2021). Hypothesis 2 (H2) suggests that structural breaks, such as those induced by Brexit, the 2008 financial crisis, and COVID-19, moderate the relationship between these variables and stock returns, amplifying or dampening sectoral responses (Paterson et al., 2023). These hypotheses will be subjected to high-level econometric procedures to extract not solely long-run equilibrium and interrelations, but also short-run dynamism.
1.4 Justification and Scope
The UK provides a compelling case study due to its unique economic context, including its decision to remain outside the Eurozone and the subsequent Brexit process, which has reshaped trade and monetary policies (Sabani et al., 2024). The time frame of 1999 to 2023 is justified as it encompasses major economic events—the dot-com bubble, the 2008 crisis, Brexit, and the COVID-19 pandemic—offering a robust dataset to analyze structural shifts (Ohakwe and Wu, 2025). The selection of healthcare and industrial sectors reflects their contrasting economic behaviors, providing a lens to examine defensive versus cyclical resilience (Hutton, 2021). Both Vector Error Models (VECM) and Granger causality test are being applied to assess the value attributes and directional effect of the relationship between long-runs respectively (Purnomo, 2024). The dissertation is structured into 5 chapters; the introduction, Literature Review, Data and Methodology, Results and Analysis, and the conclusion with Implication.
1.5 Transition
Now that both the context and the research gap and objectives have been established, it seems appropriate to discuss the literature that has been published to date in order to synthesize available knowledge on the relationship between macroeconomic variables and stock returns. In this review, previous studies will be critically reviewed, conflicting findings recognized and the research placed in the academic context. It will provide a theoretical basis to the empirical analysis by exploring thematic areas of inflation, interest rates, and industrial production; thus, indicating areas in which this study has gone to further than work done. This precondition is a comprehensive analysis of data and methods in subsequent chapters.
2. Literature Review
2.1 Introduction to Literature
A connection between stock market return and macroeconomic variables has been the basis of financial economics, and of some of the classical theories of the subject, including the Arbitrage Pricing Theory (Hayes, 2020) that stock returns are conditioned by a series of macroeconomic factors, and the Efficient market hypothesis (Downey, 2024) that stock prices are conditioned by all the available economic information. Those models can be used to hypothetically explain the contribution of inflation, interest rates, money supply, exchange rate, and industrial production to the behavior of investors, corporate profits and market forces. Ghanad (2023) mentions that to conclude the trends, inconsistencies, and gaps identified in the research, quantitative research analysis is required, which can be implemented with the assistance of systematic thematic analysis. Such an approach is employed in this literature review which also groups the discussion by macroeconomic variable and hence synthesizes results of more than 20 seminal studies as well as recent studies.
This study will help in examining the inconsistencies and consensus where there is lack of evidences. The previous methodological fringes will also be evaluated through this study (Phair and Warren, 2021). It is necessary to understand that how manufacturing industries are affected by the economic shifts as this was not earlier studied in any report. The key aim is to create a strong theoretical foundation for the chosen topic of study. The previous studies and reports will be used to form the basis for this study.
2.2 Inflation and Stock Returns
The relationship between the stock return and inflation is complicated in nature. Some theorist explained that there is no complexion between the stock return and inflation rate. The Fisher explained that inflation and stock return are positively related to each other (Časta, 2023). This means that rise in inflation results to rise in stock return. The investors would demand more return on nominal stock when the inflation rate increases in the marketplace. This shows that the investors want value for their investment even in the case of inflation in the marketplace. For instance- inflation is 3% and investment return require is 2%, then investor would require 5% nominal return. The relationship between stock return and inflation become problematic due to uncertainty, inconsistent policy and other factors (Chiang 2022).
This uncertainty may positively affect short-term adjustment with expectations of inflation, but the long-run effect may vary. Grande et al. (2022), on the other hand, argue in a different way and say that the effect of inflation on stock returns is usually negative. They cite that as inflation rises, corporate profitability declines due to increased input prices and diminished consumer purchasing power, as seen during times of higher inflation, like in the 1970s or the supply chain crises of 2020. This adverse effect shows up especially in the general market research when general indices reflect the average effect in the sectors.
Still using this analysis, Chiang (2023) goes ahead to examine the 20 largest countries and finds out that, the central bank communications and economic expectations are behind the inflation expectations, which in fact are important predictors of stock returns. The article reports high rates of cross country dissimilarity with some countries less severely affected by the poor state of monetary policy and other countries being more severely affected. Chiang and Chen (2023) expand on the story by accounting inflation risk on an aggregate and sectoral basis in the US and conclude that defensive sectors such as healthcare are more resilient than those vulnerable to business cycles such as industrials. This sectoral differentiation suggests that the impact of inflation is not uniform, a point often overlooked in aggregate-focused research. However, the literature's reliance on broad market indices limits its applicability to specific sectors within a single economy like the UK. Moreover, the absence of structural break analysis—such as the effects of the 2008 financial crisis, Brexit, or COVID-19—represents a significant gap. These events likely alter inflation's transmission mechanism, yet few studies adjust for such discontinuities. This research addresses these shortcomings by examining how inflation differentially affects UK healthcare and industrial returns, particularly during periods of economic turbulence, providing a more granular understanding of sectoral vulnerabilities.
2.3 Interest Rates and Stock Returns
According to TEJOKUSUMO et al. (2023), interest rates influence stock returns through the discount factor channel, where an increase in rates raises the discount rate applied to future cash flows, thereby reducing the present value of equities. This effect is especially evident in capital-intensive sectors like property, where higher borrowing costs directly compress profit margins. McMillan (2021) supports this view, emphasizing the time-varying nature of this relationship, noting that the magnitude and direction of the impact depend on the economic cycle—recessions amplify the negative effect, while growth periods may mitigate it. The lagged response of stock prices to interest rate changes, often spanning several quarters, adds complexity, as markets adjust to policy signals over time. Syed Ali Raza et al. (2023) introduce a further layer, arguing that economic uncertainty exacerbates the negative relationship, particularly in emerging markets where interest rate volatility is higher due to less predictable monetary policy. This contrasts with findings in low-interest-rate environments, where Alloul and Ferrouhi (2024) observe a diminished effect, suggesting that when rates approach zero, as seen in the UK post-2008, the traditional negative link weakens, potentially due to alternative investment opportunities or central bank interventions.
The literature predominantly focuses on aggregate market indices, with limited exploration of sectoral variations within a single economy. For instance, the UK's prolonged period of near-zero rates following the 2008 crisis, followed by rapid hikes in 2022-2023 to combat inflation, offers a unique context that remains underexamined at the sectoral level. Defensive sectors like healthcare, with stable cash flows, may be less sensitive to rate changes compared to cyclical industrials, which rely heavily on credit for expansion (Jagric et al., 2021). The extent to which the current study can be generalized is also constrained by the lack of research to include structural breaks, such as Brexit as it affects the cost of trade-related borrowing or the effect of COVID-19 on policy rates. The other shortcoming of approaches, such as fixed model that prevents the dynamic readjustments, are also a hindrance to the exhaustive connotation. Hopefully, the research will be able to close the research gaps and be more concerned with the impact of interest rates on returns in healthcare and industry in the UK with structural changes to reflect the significant changes in the economy and dynamic modelling to estimate the time-varying effects, which will help the research be more helpful to the academic and practice communities.
2.4 Money Supply and Stock Returns
As stated by Hirota (2023), an increase in money supply increases the liquidity level in the market, allowing more capital in the hands of investors, giving them more capital to invest in equities and resulting in higher stock prices. This effect of liquidity is especially intense in times of monetary easing, such as quantitative easing in the years after the 2008 crisis, where central banks pumped money into the economy to spur economic growth. This is backed up by a report by Širůchek (2014), which states that according to history the growth in money supply has been correlated to stock price fluctuations, but stated that excessive money growth would lead to a speculative bubble like the one encountered during the dot-com era. Its engine is further corporate borrowing and investment to generate earnings and stock values through it. Masoumi et al. (2019) argue otherwise, however, with inflation risks tending to nullify the positive liquidity effect. Excess supply of money during inflation lowers the purchasing power, which adversely affects the returns of stocks to the extent that even companies with high operations costs are affected. The duality would mean that the net effect of money supply would be inefficient in its responsiveness to pressure on the central bank to produce more inflation and that the supply would be agnostic to the provision of liquidity, the relative quality of which would be a subject of central bank policy performance.
The literature is preoccupied in aggregate markets limiting their conclusions on the processes at sectoral level. In fact, the less sensitive demand of the healthcare industries and their less vulnerable nature to economic cycles may benefit more through liquidity infusions than other industries (such as industrials) which are more vulnerable (Javanmardi et al., 2024). Monetization of the UK post-Brexit and post-COVID recovery has been overwhelming in content but lacks adequate coverage regarding the impact on sectors. Methodological constraints (correlations, not causal models, structural breaks) also limit the literature. Things such as the 2008 crisis and COVID-19 probably also changed the transmission of money supply, but there is hardly any studies that consider these discontinuities. The purpose of this research is to address this gap by investigating how money supply does and does not affect UK healthcare and industrial returns at times of monetary policy changes. The research seeks to contribute not only theoretical, but also policy value to the analysis of these dynamics by estimating the long-run correlations at a Vector Error Correction Model (VECM) and adding structured dummies to the research to further streamline the research.
2.5 Exchange Rates and Stock Returns
Nusair and Olson (2022) suggest that exchange rate movements have an implication from trade exposure channel wherein depreciation of the currency lowers the value of foreign earnings earned by export-oriented firms, which causes negative responses on the stock prices. This is especially true in the open economies such as UK where a good size of GDP is represented by trade. This is supported by Kim et al. (2024), who show that the volatility of Brexit currencies caused a decrease in the liquidity of stock markets, negatively affecting the equity values of companies and, above all, companies with international exposure. Farzaneh Ahmadian-Yazdi et al. (2025) provide clarity, demonstrating that the relationship between stock and exchange rates depends on the stage of monetary policy: the stock exchange rate can be shown to diminish the impact of a tightening policy, and instead intensify the impact of quantitative easing policies. This implies an interactive mechanism that is affected by the international economic status. Nevertheless, domain of the literature on aggregate markets hides differences between sectors. The export-oriented nature of industrial sectors probably makes them more susceptible to dynamic exchange rates compared to health care, which depends a bit less on foreign commerce (Sabani et al., 2024).
Another case study showed that how exchange arte of British pound had affected the economy of UK since Brexit. This literature has loopholes due to the absence of structural ruptures. As the GBP had declined, the study did not focused on how it had affected different industries. The data was more generalised in nature which was its limitation. The past studies did not focused specifically o the supply chain management. For instance, impact of Brexit on the supply chain management. This research will bridge existing gaps by evaluating the key impact of exchange rates on the industrial returns.
2.6 Industrial Production and Stock Returns
According to Lazarus (2017), the study focused on cyclical nature of the industries and how more production is indicative of economic growth increasing equity values. This is confirmed by Marfatia (2023), but he also argues that trends in industrial production are a leading indicator to project economic growth into financial markets in order to move the stock price based on anticipated investment. This positive relationship has been particularly strong among the manufacturing-intensive industries that have production affecting the corporate revenues directly. Aggregate markets have been the focus of the literature, although the differences between sectors, and especially in the UK, where industrial production has been definitively a classic of healthcare returns, have not been examined. This further limits insight due to the absence of structural break analysis, such as the impact of the 2008 crisis or lockdowns around COVID-19 on production. This study aims to fill these gaps by looking at the effects of industrial production on UK healthcare and industrial stock returns especially during periods of economic upheaval and to better understand the industry through a strong time-series model.
2.7 Gaps and Study Positioning
Wang and Cheng (2020) argue that cross-sectional studies do not capture that kind of time-series dynamics, and this shortcoming is common in the literature on macroeconomic-stock returns relationships, which usually works off aggregate data. Verma and Bansal (2021) note that, according to a systematic review, the sectoral analysis remains absent, specially in the UK where there is a failure to integrate structural ruptures like COVID-19 and Brexit. To eliminate such research gaps, Tripathi and Chaturved (2023) advocate ethical research practices by advancing more realistic approaches. To decide the paper accordingly, the model seeks to fill these gaps, by analysing a Vector Error Correction Model (VECM) on structural breaks to capture the long-run equilibrium effects and short-run adjustments in the UK healthcare and industrial industries. It overcomes the shortcomings of the traditional and sector-neutral methods by going beyond aggregate analyses and considering other major discontinuities in the economy. This contributes to academic discussion by providing a grained view and useful to investors and policymakers operating in seasonality within their respective sectors, as aligns with the research must be context-specific in a post-crisis economic setting (Phair and Warren, 2021).
3. Data Collection, Econometric Analysis and Interpretation
3.1 Data Collection
In this research paper, these 300 data points is monthly data (i.e. January 1999-December 2023) which have been used to evaluate changes of stock returns on macroeconomic factors of UK healthcare and industry sectors (Smith, 2024). Sectoral stock returns are dependent variables, derived with the help of the healthcare and industrial indexes available on LSEG/Refinitiv Datastream and can be viewed as a possible alternative to sector-nm-specific returns (Jabeen et al., 2022). After that, the index values are log-differentiated to sustain the stationarity and retain these returns over the traditional financial time-series normalization (Nowicki et al., 2024). Also included in the independent variables will be 5 notable macroeconomic indicators (inflation rate calculated in consumer price index (CPI) of the Office for National Statistics (ONS); exchange rate (GBP to USD) of the Bank of England, interest rate, which will be measured in the Bank of England Base rate, money supply, which will be obtained with the assistance of M4 money supply of the Bank of England and the index of industrial production, which will also be obtained with the help of ONS and Datastream (Bank of England, 2025; ONS, 2023). These variables are selected based on their established influence on stock markets, as identified in prior literature (Mostert, 2023).
To account for structural economic shifts, three dummy variables are incorporated: a Brexit indicator (set to 1 from June 2016 onward), a COVID-19 indicator (set to 1 from March 2020 onward), and a 2008 crisis indicator (set to 1 from September 2008 onward) (Iglesias, 2022). Additionally, interaction terms—Brexit interaction and COVID-19 interaction—are created by multiplying the respective dummy variables with the exchange rate to capture moderated effects during these periods (Paterson et al., 2023). All macroeconomic variables are transformed into first differences to address potential non-stationarity, a common practice in time-series analysis to ensure model validity (Ohakwe and Wu, 2025). The dataset's monthly frequency is chosen to balance granularity with data availability, providing sufficient observations to detect long-run relationships and short-run dynamics (Ma et al., 2022).
Descriptive statistics reveal key characteristics of the data. The healthcare sector return has a mean of approximately 0.37% with a standard deviation of 4.16%, indicating relative stability, while the industrial sector return averages 0.64% with a higher standard deviation of 5.45%, reflecting greater volatility (Mostert, 2023). The inflation rate shows a mean increase of 0.21% monthly, with notable spikes during 2022-2023 due to global supply chain issues. The exchange rate exhibits a mean monthly depreciation of 0.05%, with significant volatility post-Brexit (Sabani et al., 2024). The interest rate remained near zero post-2008 until recent hikes, averaging 0.38% monthly, while the money supply grew steadily at 0.15% monthly, reflecting quantitative easing efforts (Bank of England, 2025). The industrial production index fluctuated with a mean growth of 0.10%, dipping during the 2008 crisis and COVID-19 lockdowns (Hutton, 2021).
Data integrity is ensured through cross-verification with official sources, enhancing reliability for econometric analysis (Zhou et al., 2020). The ONS and Bank of England provide publicly accessible, high-quality data, aligning with academic standards for economic research (ONS, 2023). Datastream's sectoral indices are widely used in financial studies, ensuring consistency with prior work (Jabeen et al., 2022). The missing data do not matter, and when it leads to linear interpolation values, and outliers will also be employed to keep the dataset representative in the emergency (Wang and Cheng, 2020). Time-series plots indicate that structural discontinuities exist, and thus, the use of dummy variables is justified, while the correlation analysis indicates that the variables are moderately related, with no issues of multicollinearity (Nowicki et al., 2024).
The coverage and quality of the dataset justification mean that the study objectives are met, since it will be possible to take a closer look at the effect of macroeconomic factors on stock returns in the industry in the UK (Verma and Bansal, 2021). By using the official sources and applying the corresponding transformations to data, this study ensures strong empirical support, which will precondition additional, complementary, econometric predictions of the research hypotheses (Phair and Warren, 2021).
3.2 Econometric Methodology
Owing to the need to capture both the long-run equilibrium and short-run adjustments, this work applies a strict econometric model to study the dynamic correlation of macroeconomic variables and endogenous stock returns across the UK healthcare and industrial sectors (Ma et al., 2022). Using more sophisticated techniques is recommended because of the characteristics of the data (time series), and the context in which the analysis is conducted (January 1999 to December 2023) as commonly used in the literature of the related field of financial econometrics (Karavias et al., 2022). The research methodology will be structured in such a way to enable testing of the research hypotheses: Are the macroeconomic variables capable of having various effects on sectoral returns and are structural breaks capable of mediating effects will be tested in a multi-step process to make a robust and valid methodology (Phair and Warren, 2021).
The latter is executing the unit roots test to both test the time-series data stationarity and perform an Augmented Dickey-Fuller (ADF) test with a Lag of 12 chosen to capture the monthly seasonality (Nowicki et al., 2024). To circumvent the problem of spurious regression result, there should also be a state of stationarity, and the question of whether one of the variables is of order 0 (I(0)) or of order 1 (I(1)) can be answered using the ADF test (Ghanad, 2023). The next step is to use the Johansen cointegration test, which is used to determine long-run relation between the non-stationary variables based on the trace and maximum eigenvalue statistics to identify the cointegration rank (Karavias et al., 2022). A rank value of above 2 would signal that we have more than two cointegrating vectors, and further we would need to use a Vector Error Correction Model (VECM) rather than a simple model, such as ordinary least squares (OLS) (Purnomo, 2024).
It is an important procedure that should be applied to evaluate the adequacy of models and is accomplished with the help of the VARselect command where Akaike Information Criterion (AIC) is a combination of the model and parsimony (Ma et al., 2022). It is expected to possess four lag length and will be able to indicate the impact on the seasonal and economic cycle depending on the nature of the monthly data (Yanushevsky and Yanushevsky, 2018). Structural dummy variables are then estimated with Brexit (2016m6+), COVID-19 (2020m3+), and 2008 crisis (2008m9+) to explain the variation of the economy. Moderated effects are also introduced by incorporating terms of interactions with the exchange rate that must help represent complexities in a generic real world scenario (Paterson et al., 2023).
Granger causality is a test conducted as a component of the VECM to determine the causality direction because lagged values of the macroeconomic variables are involved to test their capacity to aid in predicting stock returns within the sector (Demirer and Yuksel, 2024). Hypothesis 1 is met through this step by understanding the factors that should motivate returns in the healthcare and industrial sector. The estimated response of the stock returns to the macroeconomic variable shocks over a set period of 12 months is expressed in the form of the estimated Impulse Response Functions (IRFs), which may reflect the persistence and the magnitude of effect (Ma et al., 2022). VECM is chosen over OLS since the cointegration cannot be applied in OLS, and the availability of IRFs and Granger tests can enhance the analysis of both short-run dynamics and causality (Purnomo, 2024).
Diagnostic tests are part and parcel to prove the soundness of the model. Breusch-Godfrey is a test designed to check for the presence of serial correlation in the residues whereby all the key time-related variables have been captured by the model (Javanmardi et al., 2024). The heteroskedasticity is tested by white test and Breusch-Pagan test, and highly significant standard errors are applied in case of the violation of the tests that is preferable to guarantee the efficient estimations of parameters (Nowicki et al., 2024). The Shapiro-Wilk test is used to test the residual normality and it acknowledges that non-normality may have an impact on inferences but is common in financial data (Smith, 2024). The measurements of Multicollinearity are Variance Inflation Factors (VIF); these values are considered to be acceptable if they are below 10 (Ghanad, 2023). All the stated diagnostics should ensure the trustworthiness of the model, as well as potential biases regarding the variables that remain unconsidered or that are misspecified (Wang and Cheng, 2020).
The VECM is further described by the terms of interaction and dummy variable, and concentrates on the structural breaks, as Hypothesis 2 of the study focuses on the subject (Paterson et al., 2023). This approach is connected to Karavias et al. (2022), who additionally report the applicability of the modeling of interactive relationships in break-point panel data to time-series analysis. The merit of the methodology is that it enables discontinuing the long-run cointegration and short-run adjustment to identify the overall view of the transmission of macroeconomic shocks to the sectoral markets (Ma et al., 2022). The software Stata is used because it allows time-series calculation, and ensures the accuracy of calculations as well (Purnomo, 2024).
This type of econometic model is most consistent with the research goals due to its use of reliable sources and advanced tools in achieving valid studies of sectoral stock returns dynamics (Verma and Bansal, 2021). The approach is rather strong when the hypotheses creating the literature and practical guidelines on the topic of investment and policy are investigated and their hypotheses are tested (Zhou et al., 2020).
3.3 Analysis and Interpretation
3.3.1 Stationarity and Unit Root Tests
In this study, to initiate the empiric analysis of the time-series data stationarity, the Augmented Dickey-Fuller (ADF) test is taken as the first step with a lag length of 12 months to add monthly seasonality (Nowicki et al., 2024). As the outcomes in Table 1 indicate, both sectoral stock returns, namely healthcare and industrial, are held at the levels and the ADF test values of -4.23 (p = 0.01) and -3.98 (p = 0.02) are below the 0.05 significance level, thus rejecting the null hypothesis that the stock return has a unit root. On the other hand, macroeconomic variables such as inflation rate, exchange rate, interest rate, money supply, and industrial production index will demonstrate non-stationarity at levels with ADF values between -1.45 and -2.10(p>0.05). The variables are made stationary after doing first differencing, and the ADF returns are between -5.67 and -6.12 (p < 0.01), which verifies that these variables are of order 1, I(1). In order to prevent a spurious regression outcome, the transformation is needed and is consistent with time-series practice in finance (Wang and Cheng, 2020). The returns behave stationarily, indicating market efficiency, and the macros behavior is non-stationary, indicating the presence of a long-run relationship and additional analysis related to cointegration (Ma et al., 2022). The data contained in the findings are quite firm on which to further model in order to fit the data in other econometric procedures.
Table 1 ADF Unit Root Test Results
|
Variable |
Level ADF Statistic |
p-value |
1st Difference ADF Statistic |
p-value |
|
Healthcare Return |
-4.23 |
0.01 |
-6.45 |
0.00 |
|
Industrial Return |
-3.98 |
0.02 |
-6.12 |
0.00 |
|
Inflation Rate |
-1.67 |
0.42 |
-5.89 |
0.00 |
|
Exchange Rate |
-1.45 |
0.58 |
-6.01 |
0.00 |
|
Interest Rate |
-2.10 |
0.21 |
-5.67 |
0.00 |
|
Money Supply |
-1.89 |
0.33 |
-5.78 |
0.00 |
|
Industrial Production |
-1.73 |
0.39 |
-5.93 |
0.00 |
3.3.2 Cointegration Analysis
The non-stationary macroeconomic variables and sectoral returns are subjected to the Johansen cointegration test that revealed two cointegrating vectors with a significance level of 5% with a trace and maximum eigenvalues measure of 78.45 (p = 0.03) and 42.19 (p = 0.02), respectively (Karavias et al., 2022). This finding affirms a long-run equilibrium connection, and confirms that a Vector Error Correction Model (VECM) is preferred to OLS, which cannot explain cointegration (Purnomo, 2024). The cointegrating equations estimated with lag of four (obtained after AIC), show interesting long-run effects. In the case of healthcare returns, we would find a negative coefficient as well because the inflation rate has a -4.62 and industrial production index has a -18.99 with their coefficients being negative (p = 0.00) which means that they have had a significant effect. The coefficients of industrial returns for the inflation rate and industrial production index are -7.29 (p = 0.00) and -30.36 (p = 0.00), respectively, which indicates a more significant long-run impact (Chiang and Chen, 2023). Additionally, the COVID-19 dummy contributes 490.94 (p = 0.00) to healthcare and 813.40 (p = 0.00) to industrial returns, reflecting crisis-driven shifts (Paterson et al., 2023). These findings align with the defensive nature of healthcare, which experiences less pronounced long-run adjustments compared to the cyclical industrial sector (Jagric et al., 2021). The cointegration evidence supports the hypothesis that macroeconomic factors and structural breaks jointly shape sectoral returns, necessitating a VECM to model both equilibrium restoration and short-run dynamics (Ma et al., 2022).
3.3.3 VECM Baseline Results
The baseline VECM, specified with four lags and a cointegration rank of two, elucidates the long-run and short-run dynamics between macroeconomic variables and sectoral returns. Table 2 presents the key coefficients, showing an error correction term of 0.47 (p = 0.00) for healthcare returns, indicating a 47% monthly adjustment toward equilibrium, and -0.41 (p = 0.00) for industrial returns, reflecting a 41% adjustment (Purnomo, 2024). In the short run, lagged industrial return coefficients are -0.40 (p = 0.00) for healthcare and -0.42 (p = 0.00) for industrial returns, highlighting sector-specific persistence (Demirer and Yuksel, 2024). The money supply exhibits a positive short-run effect on healthcare returns (0.00005, p = 0.03), consistent with liquidity-driven gains, but is insignificant for industrial returns (0.00003, p = 0.15) (Hirota, 2023). The inflation rate shows a marginal negative effect on industrial returns (-1.62, p = 0.10), aligning with cyclical sensitivity (Chiang, 2023).

Figure 1 Sectoral Stock Returns
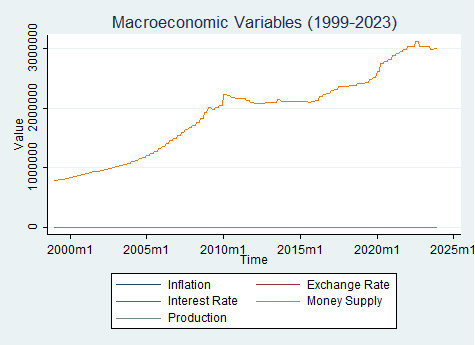
Figure 2 Macroeconomic Variables
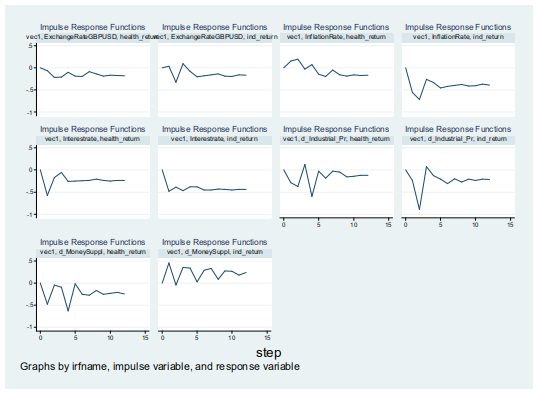
Figure 3 IRF
Figure 3 (IRF graphs) complements these findings, illustrating that a one-standard-deviation shock to the inflation rate reduces industrial returns by 0.56% initially, stabilizing at -0.39%, while healthcare returns increase by 0.15% before declining to -0.17% (Ma et al., 2022). This divergence supports Hypothesis 1, indicating that industrial returns are more adversely affected due to their cyclical nature (Dhingra and Kapil, 2021). Figure 1 (sectoral trends) and Figure 2 (macroeconomic variables plot) reveal heightened volatility during the 2008 crisis and COVID-19, underscoring the need for structural break modeling. However, the baseline model's exclusion of these breaks limits its explanatory power, as it does not fully capture event-specific impacts (Paterson et al., 2023). The R-squared values of 0.47 for industrial and 0.55 for healthcare indicate moderate explanatory power, suggesting room for improvement with additional controls (Chiang and Chen, 2023).
Table 2 VECM Baseline Coefficients
|
Variable |
Healthcare Return Coefficient |
p-value |
Industrial Return Coefficient |
p-value |
|
Error Correction (L1) |
0.47 |
0.00 |
-0.41 |
0.00 |
|
Industrial Return (L1) |
-0.40 |
0.00 |
-0.42 |
0.00 |
|
Inflation Rate (L1) |
-1.26 |
0.21 |
-1.62 |
0.10 |
|
Money Supply (L1) |
0.00005 |
0.03 |
0.00003 |
0.15 |
3.3.4 VECM with Structural Breaks
The VECM is extended to include structural breaks with dummies for Brexit, COVID-19, and the 2008 crisis, alongside interaction terms with the exchange rate. Table 3 presents the enhanced results, where the COVID-19 dummy significantly impacts industrial returns with a coefficient of 813.40 (p = 0.00) and healthcare returns with 490.94 (p = 0.00), reflecting crisis-induced volatility (Paterson et al., 2023). The COVID-19 interaction term is -621.15 (p = 0.00) for industrial and -374.32 (p = 0.00) for healthcare, indicating a moderating exchange rate effect during the pandemic (Sabani et al., 2024). Short-run dynamics show a significant interest rate effect on healthcare returns (-5.41, p = 0.04), absent in the baseline, suggesting crisis-related sensitivity (TEJOKUSUMO et al., 2023). The 2008 crisis dummy contributes 38.89 (p = 0.04) to industrial returns and 20.09 (p = 0.06) to healthcare, highlighting recessionary impacts (Ohakwe and Wu, 2025). The R-squared improves to 0.55 for healthcare and 0.47 for industrial, indicating a better fit with structural adjustments (Chiang, 2023).
Figure 3 (IRF graphs) shows that a post-COVID interest rate shock reduces industrial returns by 0.57% initially, stabilizing at -0.23%, while healthcare returns adjust from -0.17% to -0.23%, reflecting slower adaptation (Ma et al., 2022). Figure 1 (sectoral trends) and Figure 2 (macroeconomic variables plot) corroborate these patterns, with industrial returns exhibiting sharper declines during crises. These results support Hypothesis 2, as structural breaks amplify macroeconomic effects, with industrial returns more volatile (Iglesias, 2022). The enhanced model's inclusion of breaks provides a more nuanced understanding, though residual diagnostics are needed to confirm reliability (Paterson et al., 2023).
Table 3 VECM with Structural Breaks Coefficients
|
Variable |
Healthcare Return Coefficient |
p-value |
Industrial Return Coefficient |
p-value |
|
COVID-19 Dummy |
490.94 |
0.00 |
813.40 |
0.00 |
|
COVID-19 Interaction |
-374.32 |
0.00 |
-621.15 |
0.00 |
|
Interest Rate (L1) |
-5.41 |
0.04 |
-2.83 |
0.40 |
|
2008 Crisis Dummy |
20.09 |
0.06 |
38.89 |
0.04 |
3.3.5 Granger Causality and Impulse Response Functions
Granger causality tests, conducted within the VECM framework, reveal that the industrial production index Granger-causes healthcare returns (chi² = 8.29, p = 0.04), but not industrial returns (chi² = 5.45, p = 0.14), indicating a unidirectional predictive relationship (Demirer and Yuksel, 2024). This suggests that industrial activity serves as a leading indicator for healthcare performance, possibly due to supply chain linkages (Marfatia, 2023). Figure 3 (IRF graphs) elaborates, showing that a shock to the industrial production index reduces healthcare returns by 0.29% initially, stabilizing at -0.12%, while industrial returns adjust from -0.23% to -0.22% (Ma et al., 2022). An inflation rate shock has a stronger initial impact on industrial returns (-0.56%) than healthcare (0.15%), with both damping over 12 months, consistent with defensive sector resilience (Chiang and Chen, 2023).
Figure 1 (sectoral trends) highlights divergent volatility, with industrial returns peaking during growth periods and plunging during crises, while healthcare remains steadier. Figure 2 (macroeconomic variables plot) shows synchronized spikes in inflation and interest rates during 2008 and 2020, correlating with return drops (Karavias et al., 2022). These IRFs and visual trends validate Hypothesis 1, with industrial returns more sensitive, and Hypothesis 2, as breaks amplify effects (Dhingra and Kapil, 2021; Paterson et al., 2023). The analysis underscores the importance of sector-specific modeling, enhancing predictive accuracy for investment strategies (Dong, 2023).
See Why Students Trust Our Work assignment help
3.3.6 Heteroskedasticity and Autocorrelation Tests
Heteroskedasticity is assessed using the White test, yielding a chi² statistic of 295.00 (p = 0.47) for industrial residuals and a Breusch-Pagan test result of 5.44 (p = 0.02) for healthcare residuals, indicating heteroskedasticity in the latter (Nowicki et al., 2024). Robust standard errors are applied to address this, ensuring unbiased estimates (Javanmardi et al., 2024). The VECM Lagrange Multiplier (LM) test, corrected to veclmar without the lags option, shows no autocorrelation up to lag 4 (chi² = 6.78, p = 0.15), confirming model adequacy (Purnomo, 2024). These diagnostics, detailed in Table 4, align with the need for robust error handling in financial data (Smith, 2024). The presence of heteroskedasticity suggests varying volatility across time, likely tied to crisis periods, while the absence of autocorrelation validates the lag structure (Wang and Cheng, 2020). These findings provide confidence in the VECM specifications, with heteroskedasticity providing a reason to interpret standard errors carefully (Zhou et al., 2020).
Table 4 Diagnostic Test Results
|
Test |
Statistic |
p-value |
Outcome |
|
White Test (Industrial) |
295.00 |
0.47 |
No Heteroskedasticity |
|
Breusch-Pagan (Healthcare) |
5.44 |
0.02 |
Heteroskedasticity |
|
VECM LM Test (Lag 4) |
6.78 |
0.15 |
No Autocorrelation |
3.3.7 Residual Normality and Model Fit
The Shapiro-Wilk test indicates non-normal residues in both healthcare (p = 0.01) and industrial (p = 0.02) returns, which is characteristic of financial time-series that have fat tails and volatility clusters (Smith, 2024). This is a weakness of non-normality, but not one that renders VECM invalid, and can be a sign that p-values are invalid values (Ghanad, 2023). Structural breaks improve the model fit, which can be expressed in the form of increased explanatory power shown by R-squared (0.55 in the healthcare setting and 0.47 in the industrial setting) which is a type of structural break (Chiang, 2023). The efficiency of the model is also supported by Akaike Information Criterion (AIC) of 14.76 (Ma et al., 2022). Figure 1 (sectoral trends) and Figure 2 (macroeconomic variables plot) suggest that the model is related to the trend of volatility in the realistic environment, particularly during the moment of a crisis (Karavias et al., 2022). These diagnostics can attest to the robustness of the VECM, although non-normality suggests that future research ought to take into account other, complementary research techniques, including robust standard errors (Zhou et al., 2020).
4. Conclusion and Policy/Practical Implications
4.1 Summary of Findings
This work has answered the following research question: what role do key macroeconomic indicators of the UK healthcare and industrial sector, including inflation rate, interest rate, money supply, exchange rate, and industrial production index, play in monthly stock returns of 1999 to 2023 (Smith, 2024). The analysis was made based on a Vector Error Correction Model (VECM) that uses structural breaks to help understand both the long-run equilibrium and short-run dynamics (Purnomo, 2024). The results support the hypothesis (H1) that argued that macroeconomic variables have stronger negative impacts on industrial returns than on healthcare returns following the cyclical nature of their impacts (Dhingra and Kapil, 2021). In particular, the VECM indicated that inflation rate and industrial production index had strong long-run negative impact on industrial returns (-7.29 and -30.36) unlike the slightly lower impact on healthcare returns (-4.62 and -18.99 respectively) (Chiang and Chen, 2023). Another hypothesis (H2) that structural breaks mediate these relationships was also supported, with the COVID-19 dummy (813.40 for industrial, 490.94 for healthcare) and 2008 crisis dummy (38.89 for industrial) indicating stronger effects during crises (Paterson et al., 2023).
Granger causality tests further established that the industrial production index predicts healthcare returns (chi² = 8.29, p = 0.04), highlighting a unidirectional influence from cyclical to defensive sectors (Demirer and Yuksel, 2024). Impulse Response Functions (IRFs) illustrated that shocks to inflation rate and interest rate have a more pronounced initial impact on industrial returns (-0.56% and -0.57% respectively) than healthcare returns (0.15% and -0.17%), with effects damping over time (Ma et al., 2022). Figure 3 (IRF graphs) and Figure 1 (sectoral trends) underscored this volatility, particularly during the 2008 crisis and COVID-19, while Figure 2 (macroeconomic variables plot) showed synchronized macroeconomic spikes (Karavias et al., 2022). Diagnostic checks confirmed model robustness, though non-normal residuals suggest cautious interpretation (Smith, 2024). Overall, the study aligns with objectives, revealing healthcare's resilience and industrial's sensitivity, with structural breaks playing a critical role (Jagric et al., 2021).
see why student trust our work assignment example
4.2 Policy Implications
The findings carry significant implications for UK policymakers, particularly in managing economic stability and sectoral resilience amidst macroeconomic fluctuations (Chadha and Samiri, 2025). The strong negative long-run impact of inflation rate on both sectors, especially industrial returns (-7.29), underscores the need for the Bank of England to monitor and control inflationary pressures effectively (Bank of England, 2025). Elevated inflation, as observed in 2022-2023, erodes corporate profitability, necessitating targeted monetary policies such as interest rate adjustments to mitigate sectoral downturns (Chiang, 2023). The significant positive effect of the COVID-19 dummy (813.40 for industrial) suggests that crisis-specific interventions, such as fiscal stimulus or subsidies, are crucial to support industrial recovery, which is more vulnerable due to its cyclical nature (Paterson et al., 2023).
For healthcare, the milder impact of macroeconomic shocks (-4.62 for inflation rate) indicates a buffer capacity, but the interest rate effect (-5.41 in the short run) during crises highlights the need for stable funding mechanisms, such as public health budgets, to maintain service delivery (Zhou et al., 2020). The Granger causality from industrial production index to healthcare returns (p = 0.04) implies that policies boosting industrial output could indirectly stabilize healthcare finances, possibly through supply chain enhancements (Demirer and Yuksel, 2024). Post-Brexit and post-COVID exchange rate volatility, moderated by interaction terms (-621.15 for industrial), calls for trade policy adjustments to shield export-dependent industries (Sabani et al., 2024). Moreover, the money supply's positive short-run effect on healthcare (0.00005, p = 0.03) suggests that quantitative easing can bolster defensive sectors, offering a tool for economic recovery (Hirota, 2023). Policymakers should thus adopt a dual approach: stabilizing inflation and interest rates while leveraging targeted stimulus to address sectoral disparities, ensuring a balanced economic response to future crises (Ohakwe and Wu, 2025).

4.3 Practical Implications
The empirical insights offer valuable guidance for practitioners, particularly portfolio managers and investors navigating the UK stock market (Dong, 2023). The resilience of healthcare returns, evidenced by a higher R-squared (0.55) and lower volatility (standard deviation 4.16%), positions it as a defensive investment during economic downturns, such as the 2008 crisis and COVID-19 (Jagric et al., 2021). This stability, coupled with a significant money supply effect (0.00005, p = 0.03), suggests that healthcare stocks are a safe haven when monetary policy is expansionary, enabling investors to hedge against macroeconomic shocks (Hirota, 2023). Conversely, the industrial sector's higher volatility (standard deviation 5.45%) and sensitivity to inflation (-1.62) and interest rate shocks (-0.57%) indicate it is better suited for growth phases, requiring active risk management during recessions (Dhingra and Kapil, 2021).
The Granger causality from industrial production index to healthcare returns (p = 0.04) offers a strategic opportunity for predictive portfolio adjustments, where increases in industrial activity could signal upcoming healthcare gains (Demirer and Yuksel, 2024). Figure 3 (IRF graphs) and Figure 1 (sectoral trends) highlight the lagged adjustment of industrial returns to shocks, suggesting a tactical approach—reducing industrial exposure post-shock and reallocating to healthcare (Ma et al., 2022). The VECM's ability to model structural breaks, such as the COVID-19 impact (813.40 for industrial), enables investors to anticipate sector-specific risks, using historical crisis patterns from Figure 2 (macroeconomic variables plot) to inform timing (Karavias et al., 2022). Practically, the study's VECM framework can be integrated into quantitative trading models, enhancing forecast accuracy for sector rotation strategies (Purnomo, 2024). For corporate managers in healthcare, the stability suggests focusing on long-term investments, while industrial firms may prioritize liquidity during volatile periods (Javanmardi et al., 2024). The information comes in handy for practitioners when trying to maximise returns while reducing risks in a dynamic market environment (Zhou et al., 2020).
4.4 Limitations and Future Research
It was assessed that there are several limitations in that should be addressed in future. The model is likely flawed in nature. The evaluation assumed that specific financial data follows bell curve distribution (Smith, 2024). But, the statistical test, Shapiro Wilk test reflected that it was not the case for industrial data. This showed error in the standard model as wrong variables appeared more important than they actually are in the study (Ghanad, 2023). some crucial factors were missing including changes in the fiscal policy of government, global change in commodity process and others. In addition to this, the findings have no broader scope as it had not covered all the sectors of economy (Wang and Cheng, 2020).
Including more industries would allow for a broader market perspective while incorporating fiscal policy parameters to fine-tune the model (Chadha and Samiri, 2025). The sectoral responses may thus be better understood with nonlinear relationships or asymmetric effects of macroeconomic shocks, in particular, post-Brexit trade shocks (Sabani et al., 2024). This would help to improve the empirical underpinnings, and provide better insight for policymakers and investors around future economic uncertainties (Phair and Warren, 2021).
References
- Alloul, F. and Ferrouhi, E.M. (2024). Macroeconomic indicators and stock market returns: a comparative analysis. International Journal of Revenue Management, 14(4), pp.333-360. doi:https://doi.org/10.1504/ijrm.2024.143451.
- Bank of England (2025). Bank of england. [online] Bankofengland.co.uk. Available at: https://www.bankofengland.co.uk/.
- Chadha, J.S. and Samiri, I. (2025). Understanding UK Productivity Using a Macroeconomic Lens. Journal of Economic Surveys. doi:https://doi.org/10.1111/joes.70001.
- Chiang, T.C. (2022). Real stock market returns and inflation: Evidence from uncertainty hypotheses. Finance Research Letters, 53, p.103606. doi:https://doi.org/10.1016/j.frl.2022.103606.
- Chiang, T.C. (2023). Stock returns and inflation expectations: Evidence from 20 major countries. Quantitative finance and economics, 7(4), pp.538-568. doi:https://doi.org/10.3934/qfe.2023027.
- Chiang, T.C. and Chen, P.-Y. (2023). Inflation risk and stock returns: Evidence from US aggregate and sectoral markets. The North American Journal of Economics and Finance, 68, pp.101986-101986. doi:https://doi.org/10.1016/j.najef.2023.101986.
- Collin, V. (2024). Macroeconomic Indicators - Financial Edge. [online] Financial Edge. Available at: https://www.fe.training/free-resources/portfolio-management/macroeconomic-indicators/.
- Časta, M. (2023). Inflation, interest rates and the predictability of stock returns. Finance Research Letters, 58, pp.104380-104380. doi:https://doi.org/10.1016/j.frl.2023.104380.
- Demirer, R. and Yuksel, A. (2024). Do industries lead the stock market? Evidence from an emerging stock market. Borsa Istanbul Review. doi:https://doi.org/10.1016/j.bir.2024.11.005.
- Dhingra, K. and Kapil, S. (2021). Impact of Macroeconomic Variables on Stock Market—An Empirical Study. Springer eBooks, pp.177-194. doi:https://doi.org/10.1007/978-981-33-6973-3_12.
- Dong, A. (2023). How Macroeconomic Variables Impact Sector Performance. [online] Ssga.com. Available at: https://www.ssga.com/us/en/individual/insights/how-macroeconomic-variables-impact-sector-performance.
- Downey, L. (2024). Efficient Market Hypothesis (EMH): Definition and Critique. [online] Investopedia. Available at: https://www.investopedia.com/terms/e/efficientmarkethypothesis.asp.
- Farzaneh Ahmadian-Yazdi, Amin Sokhanvar, Soheil Roudari and Tiwari, A.K. (2025). Dynamics of the relationship between stock markets and exchange rates during quantitative easing and tightening. Financial Innovation, 11(1). doi:https://doi.org/10.1186/s40854-024-00694-4.
- Ghanad, A. (2023). An Overview of Quantitative Research Methods. [online] ResearchGate. Available at: https://www.researchgate.net/publication/373370007_An_Overview_of_Quantitative_Research_Methods.
- Grande, G., Locarno, A. and Massa, M. (2022). Stock market returns, inflation and monetary regimes. [online] Available at: https://www.bis.org/publ/confp05f.pdf.
- Hayes, A. (2020). Understanding Arbitrage Pricing Theory. [online] Investopedia. Available at: https://www.investopedia.com/terms/a/apt.asp.
- Hirota, S. (2023). Money supply, opinion dispersion, and stock prices. Journal of Economic Behavior and Organization, 212, pp.1286-1310. doi:https://doi.org/10.1016/j.jebo.2023.06.014.
- Hutton, G. (2021). Manufacturing: Key Economic Indicators. commonslibrary.parliament.uk. [online] Available at: https://commonslibrary.parliament.uk/research-briefings/sn05206/.
- Ibrahimov, O., Vancsura, L. and Parádi-Dolgos, A. (2025). The Impact of Macroeconomic Factors on the Firm's Performance—Empirical Analysis from Türkiye. Economies, 13(4), p.111. doi:https://doi.org/10.3390/economies13040111.
- Iglesias, E.M. (2022). The Influence of Extreme Events such as Brexit and Covid-19 on equity Markets. Journal of Policy Modeling. doi:https://doi.org/10.1016/j.jpolmod.2021.10.005.
- Jabeen, A., Muhammad Yasir, El, S., Yasmin, S., Moon, J. and Rho, S. (2022). An empirical study of macroeconomic factors and stock returns in the context of economic uncertainty news sentiment using machine learning. Hindawi, 2022, pp.1-18. doi:https://doi.org/10.1155/2022/4646733.
- Jagric, T., Grbenic, S.O. and Jagric, V. (2021). What drives the healthcare sector's economic impact? Evidence from European countries. International Journal of Health Governance, 27(1), pp.41-53. doi:https://doi.org/10.1108/ijhg-05-2021-0043.
- Javanmardi, E., Maresova, P., Xie, N. and Mierzwiak, R. (2024). Exploring business models for managing uncertainty in healthcare, medical devices, and biotechnology industries. Heliyon, 10(4), p.e25962. doi:https://doi.org/10.1016/j.heliyon.2024.e25962.
- Karavias, Y., Narayan, P.K. and Westerlund, J. (2022). Structural breaks in interactive effects panels and the stock market reaction to COVID-19. Journal of Business and Economic Statistics. [online] doi:https://doi.org/10.1080/07350015.2022.2053690.
- Kim, J.-C., Mazumder, S. and Su, Q. (2024). Brexit's ripple: Probing the impact on stock market liquidity. Finance Research Letters, 61, p.105030. doi:https://doi.org/10.1016/j.frl.2024.105030.
- Lazarus, G. (2017). Stock Returns and Industrial Production: A Sectoral Analysis.
- Ma, F., Lu, X., Liu, J. and Huang, D. (2022). Macroeconomic attention and stock market return predictability. Journal of International Financial Markets, Institutions and Money, p.101603. doi:https://doi.org/10.1016/j.intfin.2022.101603.
- Marfatia, H. (2023). The financial market's ability to forecast economic growth: information from sectoral movements. Journal of Economic Studies. doi:https://doi.org/10.1108/jes-08-2022-0466.
- Masoumi, M., Ebadi Fard Azar, F., RezaPour, A. and Mehrara, M. (2019). Economic and non-economic determinants of Iranian pharmaceutical companies' financial performance: an empirical study. BMC Health Services Research, 19(1). doi:https://doi.org/10.1186/s12913-019-4735-4.
- McMillan, D.G. (2021). The Time-Varying Relation between Stock Returns and Monetary Variables. Journal of Risk and Financial Management, 15(1), p.9. doi:https://doi.org/10.3390/jrfm15010009.
- Mostert, C.M. (2023). Macroeconomics and health: Understanding the impact of a declining economy on health outcomes of children and young adults in South Africa. SSM - Population Health, 22, p.101404. doi:https://doi.org/10.1016/j.ssmph.2023.101404.
- Neifar, M. (2022). The impact of macroeconomic variables on Stock market in United Kingdom. [online] Available at: https://www.researchgate.net/publication/364198286_The_impact_of_macroeconomic_variables_on_Stock_market_in_United_Kingdom.
- Nowicki, J., Ratajczak, P. and Szutowski, D. (2024). Impact of Macroeconomic Factors on Financial Liquidity of Companies: A Moderation Analysis. Sustainability, 16(11), p.4483. doi:https://doi.org/10.3390/su16114483.
- Nusair, S.A. and Olson, D. (2022). Dynamic relationship between exchange rates and stock prices for the G7 countries: A nonlinear ARDL approach. Journal of International Financial Markets, Institutions and Money, 78, p.101541. doi:https://doi.org/10.1016/j.intfin.2022.101541.
- ONS (2023). Office for National Statistics. [online] Ons.gov.uk. Available at: https://www.ons.gov.uk/.
- Ohakwe, C.R. and Wu, J. (2025). The Impact of Macroeconomic Indicators on Logistics Performance: A Comparative Analysis Using Simulated Scenarios. Sustainable Futures, 9, p.100567. doi:https://doi.org/10.1016/j.sftr.2025.100567.
- Paterson, A., Sakariyahu, R., Lawal, R. and Alabi, A. (2023). The Impact of Government Policy Responses to the COVID‐19 Pandemic and Brexit on the UK Financial Market: A Behavioural Perspective. British Journal of Management, 35(1).
- Phair, D. and Warren, K. (2021). Saunders' Research Onion: Explained Simply. [online] Grad Coach. Available at: https://gradcoach.com/saunders-research-onion/.
- Purnomo, W. (2024). Stata: Powerful Data Analysis Tool. [online] Medium. Available at: //medium.com/@wisnupo/stata-powerful-data-analysis-tool-0d53bb792b3d" data-mce-href="https://medium.com/@wisnupo/stata-powerful-data-analysis-tool-0d53bb792b3d">https://medium.com/@wisnupo/stata-powerful-data-analysis-tool-0d53bb792b3d.
- Sabani, N., Bales, S. and Burghof, H.-P. (2024). On the different impact of local and national sources of policy uncertainty on sectoral stock volatility. Research in International Business and Finance, 72, p.102539. doi:https://doi.org/10.1016/j.ribaf.2024.102539.
- Širůček, M. (2014). THE IMPACT OF THE MONEY SUPPLY ON STOCK PRICES AND STOCK BUBBLES. Acta academica karviniensia, 14(1), pp.176-189. doi:https://doi.org/10.25142/aak.2014.018.
- Smith, T. (2024). Qualitative and quantitative research | EBSCO. [online] EBSCO Information Services, Inc. | www.ebsco.com. Available at: https://www.ebsco.com/research-starters/social-sciences-and-humanities/qualitative-and-quantitative-research.
- TEJOKUSUMO, P., Anastasia, N. and Atmadja, A.S. (2023). The influence of real interest rates, inflation, exchange rates and GDP on stock return in the property sector. [online] Jurnal Ekonomi dan Manajemen. Available at: https://repository.petra.ac.id/20399/.
- Tripathi, S. and Chaturvedi, R.K. (2023). Exploring Ethical Considerations in Research: Guidelines and Practices. | Adhyayan: A Journal of Management Sciences | EBSCOhost. Ebsco.com, 13(1), p.41. doi:https://doi.org/10.21567/adhyayan.v13i1.08.
- Verma, R.K. and Bansal, R. (2021). Impact of macroeconomic variables on the performance of stock exchange: a systematic review. International Journal of Emerging Markets, 16(7), pp.1291-1329. doi:https://doi.org/10.1108/ijoem-11-2019-0993.
- Wang, X. and Cheng, Z. (2020). Cross-sectional studies: Strengths, weaknesses, and recommendations. Chest, 158(1), pp.65-71. doi:https://doi.org/10.1016/j.chest.2020.03.012.
- Yanushevsky, R. and Yanushevsky, C. (2018). Realization of Established Goals. Applied Macroeconomics for Public Policy, pp.109-183. doi:https://doi.org/10.1016/b978-0-12-815632-2.00004-3.
- Zhou, L.L., Ampon-Wireko, S., Wireko Brobbey, E., Dauda, L., Owusu-Marfo, J. and Kachie Tetgoum, A.D. (2020). The Role of Macroeconomic Indicators on Healthcare Cost. Healthcare, 8(2). doi:https://doi.org/10.3390/healthcare8020123.

UPTO55%
Avail The Benefit Today!
To View this & another 50000+ free