Introduction
The present report is founded on the Convocation Event Management project that was presented in the form of a team presentation and can now be critically evaluated as a reflective analysis on an individual basis. The project aimed at resolving the major operational inefficiencies of the convocation process in the university that was depending on manual fragmented systems to carry out registration processes, robe collection, and event coordination. The reason behind the choice of this project is the fact that convocation is a high-impact and time-sensitive event whose lack of proper planning has a direct impact on student satisfaction, institutional image, and efficiency in its operations.
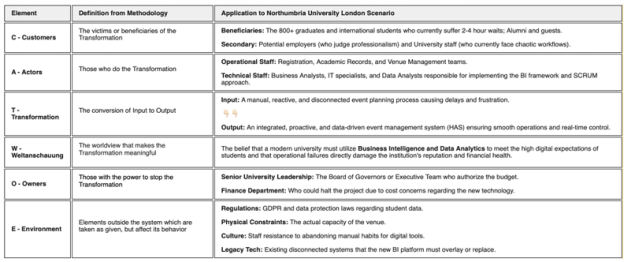
The first problem analysis was organised with the help of Soft Systems Methodology (SSM). The intricate relationships among the stakeholders, manual procedures, queues, and reputational risks were visualised with the help of a Rich Picture whereas CATWOE analysis aided in elucidating customers, actors, transformation processes, and environmental restrictions (L. Okdinawati & Imran, 2024). These SSM outputs also made sure that the problem is perceived in totality before technical or managerial solutions are suggested to it.
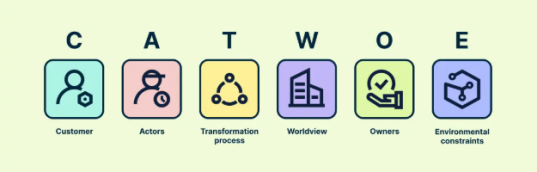
Source: (Creately, 2024)
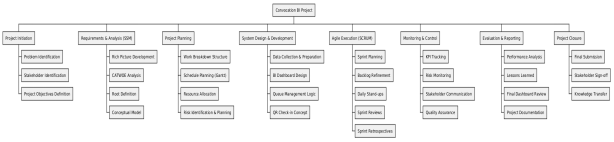
The project took a hybrid project management strategy, which included SSM to structure the problems, Agile SCRUM to develop and deliver the iterative system and PMBOK/Waterfall checkpoints to govern and control the project. The main tools consisted of Trello to manage sprints and tasks, Gantt charts to see the timeline, and Excel along with Power BI dashboards to analyze the data and monitor the performance (Lechner, 2025). A critical analysis is carried out on the planning, execution, and evaluation phases of the project in the next section.
Critical Analysis of Planning, Execution, and Evaluation
2.1 Planning Phase
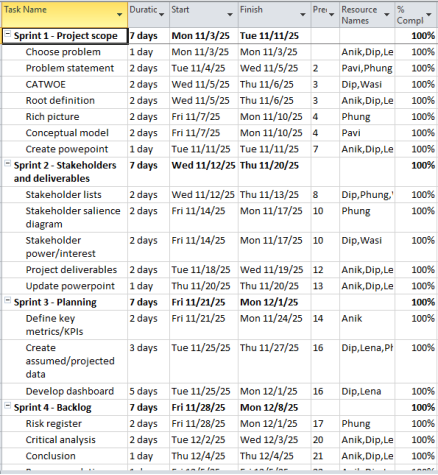
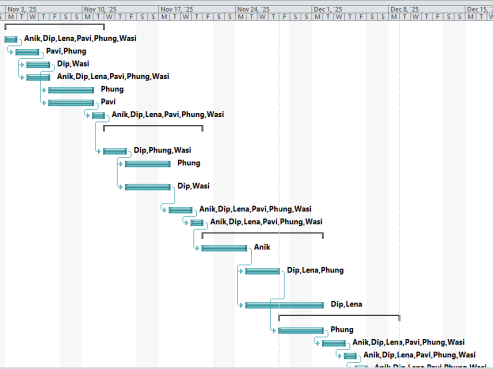
Planning phase involved the Soft Systems Methodology (SSM) that aided in requirements discovery in a people-focused complex environment. The Rich Picture was able to visually represent fragmented processes, frustrations of stakeholders, long queues, reputational risks and create a common understanding of the issue. This was renewed with the CATWOE analysis that helped to make clear customers, actors, transformation goals, ownership, and environmental constraints including GDPR and venue capacity. After the problem space became structured, the standard planning models such as the Work Breakdown Structure (WBS), PERT and a Gantt chart were used to specify tasks, sequencing and milestones (Haque & Mathur, 2025). The SSM helped in participative and exploratory planning as opposed to the traditional PMBOK planning that presumes that the requirements are fixed and well known. This style was more appropriate since there was uncertainty, multiple stakeholders and behavioural issues involved in dealing with such a massive convocation event.
2.2 Execution Phase
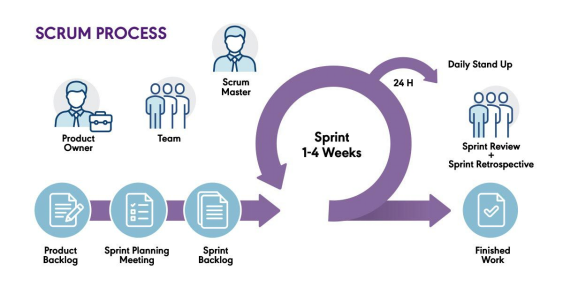
The execution of the project was done in the Agile SCRUM principles, which enabled the team to deliver the solution in the form of short sprints. Its key activities were backlog refinement, daily stand-ups to monitor the progress of activities and blockers, and sprint demonstrations to present the results of the work, including dashboards and risk registers (Patmore, 2025). The main tool of execution has been the Trello, which is inspired by the Kanban-style of visibility and flexibility to re-prioritise tasks with new understanding coming in. This was against the Gantt chart, which provided more definite control on dependencies, as well as milestones tracking, but was not adaptive in the course of execution. The visual workflow provided by Trello aided in collaboration and ownership among the team members especially in handling parallel assignments in the data of analytics, risk management, and stakeholder analysis. Nevertheless, Gantt planning was still useful to keep the overall discipline of the schedule and be aligned with the requirements of academic and governance.
2.3 Evaluation Phase
Performance measurement was carried out using sprint reviews and retrospectives and was backed by quantitative measurements of performance. The major KPIs were queue time, wait time in robe, system error rates, staffing levels, and student satisfaction. Excel and Power BI dashboards gave visual data, which showed the peak time of congestion, low QR usage, and the high correlation between long queues and low satisfaction. Agile retrospectives made it possible to learn and change quickly, including noticing system reliability and staff shortages as the main factors contributing to horrible experience (Hedges, 2025). Agile reviews had quicker feedback and constant improvement compared to formal stage-gate reviews, yet had less built-in approval control. Having both methods combine enabled the project to enjoy the advantage of a data-driven approach and still be accountable, such that the lessons learned can contribute to the short-term and long-term planning of the convocation.
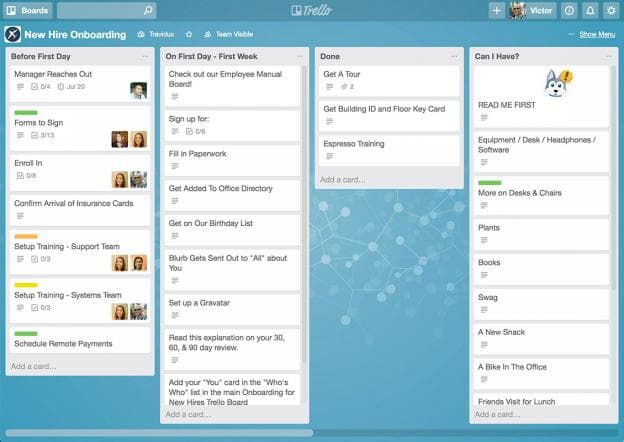
Figure 5: Trello Board
Source: (Project Manager, 2018)
Stakeholder Identification and Conflict Evaluation
3.1 Stakeholder Mapping
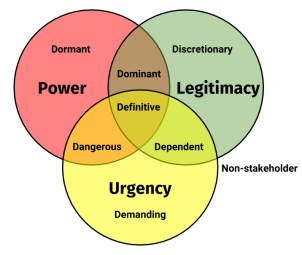
Both the Stakeholder Salience Model and Power Interests Matrix were used to identify the stakeholders in a systematic manner. The most important internal stakeholders were the senior management of the university, the event and project management team, information and digital systems personnel, and the academic registry because they had high power and high interest since they could determine governance, data integrity and delivery of operations. The external stakeholders included the graduating students, guests and families, robe suppliers, photographers, and the venue service providers and they were majorly interested in the quality of service and experience of the event. Salience model also identified definitive, dominant and dependent stakeholders so that the effort to engage with stakeholders can be prioritised in terms of power, legitimacy and urgency (Ma, 2023).
3.2 Stakeholder Engagement
Engagement of stakeholders was based on the stakeholder influence and information requirements. The senior management and IT teams, which were considered as the high power and high interest stakeholders, were involved in a weekly progress meeting, shared dashboards, and formal updates that were aimed at facilitating the decision-making process and risk management. Daily stand-ups and Trello boards were applied by the project team according to the coordination of activities inside the project and dependencies. The academic registry and venue teams were provided with weekly data summaries on the requirement of eligibility, capacity, and compliance. External stakeholders such as students and suppliers were involved mostly through ad-hoc communication, briefing documents, and updates on the day-to-day affairs (Thompson-Dyck & Schalewski, 2023). This organised communication strategy ensured that all the stakeholders were provided with pertinent information in time, and the information overload was reduced as well as assisted in synchronising all the departments.
Source: (Singh, 2022)
3.3 Conflict Sources and Management
In the project, a number of conflict sources were manifested, which are as follows: budget versus scope trade-offs, opposition to new digital tools, and issues of data ownership between the IT and academic registry teams. The management of these conflicts was done in facilitated workshops, which promoted mutual understanding and compromise. The use of RACI matrix ensured clarity and accountability and minimized duplication of roles and responsibilities (Aguilar & Li, 2023). There were also established approval processes so that any change in cost, scope or data governance was reviewed and approved in a formal manner. The organized conflict management strategy was used to balance conflicting priorities without stopping the project movement and stakeholder confidence.
Risk Assessment and Mitigation
4.1 Risk Register
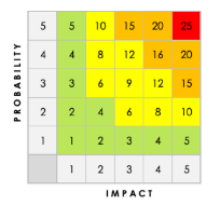
Table 1: Risk Register
|
Risk ID |
Risk Description |
Impact Level (1-5) |
Probability Level (1-5) |
Priority Level (Impact × Probability) |
Mitigation Notes |
Status |
|
RT008 |
Uneven skill distribution creating dependency on one person |
5 |
5 |
25 |
Cross-training, documentation, knowledge sharing sessions, regular team meetings |
Closed |
|
R009 |
Team member consistently missing personal deadlines |
4 |
5 |
20 |
Time management training, milestone tracking, accountability partners |
Closed |
|
RT004 |
Poor communication leading to misunderstandings and mistakes |
5 |
3 |
15 |
Regular team meetings, written confirmation of decisions, communication protocols |
Closed |
|
RT005 |
Team member stops responding or participating |
5 |
3 |
15 |
Regular contact requirements, buddy system, engagement monitoring |
Closed |
|
RT001 |
Team member frustration due to unequal workload distribution |
3 |
4 |
12 |
Regular workload reviews, transparent task allocation, team check-ins |
Closed |
|
RT007 |
Loss of motivation due to academic pressure from other modules |
3 |
3 |
9 |
Workload prioritisation, time management support, regular motivation checks |
Closed |
|
RT006 |
Language barriers affecting understanding |
3 |
2 |
6 |
Clear written instructions, visual aids, patience and support |
Closed |
|
RT002 |
Team member becomes seriously ill and unable to contribute |
4 |
1 |
4 |
Regular wellness checks, flexible working arrangements, workload monitoring |
Closed |
|
RT003 |
Team member's family emergency requiring extended absence |
4 |
1 |
4 |
Emergency contact procedures, flexible arrangements, emotional support |
Closed |
|
R007 |
Personal technology failures (laptop crash, internet issues) |
3 |
1 |
3 |
Backup systems, cloud storage, technology support resources |
Closed |
4.2 Risk Analysis
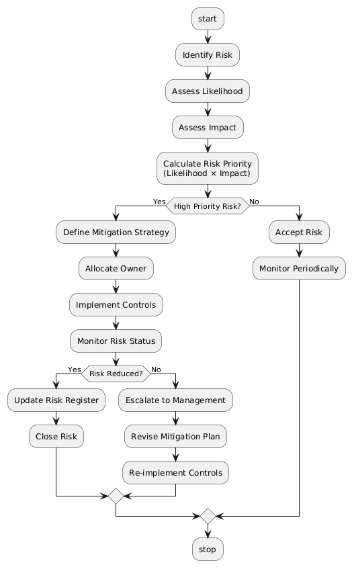
A Likelihood x Impact scoring method was used to prioritize risks and the project risks could be compared objectively and ranked. This strategy made sure that risks having high probability and high consequences like system malfunction during peak-registration were tackled first. The application of Gantt chart also facilitated deterministic planning as it helped in determining the critical tasks, dependencies and milestones that provided the clarity of when the risks were most likely to happen (Wadhwa, 2024). Deterministic schedules however, are based on predictable conditions and fail to adequately represent uncertainty in the patterns of arrival, system load or human behaviour.
Struggling with reflective project reports? Get expert Project Management assignment help tailored to real-world case studies.
On the other hand, probabilistic forecasting could have been used to predict changes in student arrival time, system response rate and staffing levels, like Monte Carlo simulation. Although it was not applied, these methods would have enabled determining the confidence ranges on the queue times and system performance, which would have enhanced the buffer planning. Deterministic planning of structure and probabilistic thinking of the uncertainty improved risk sensitivity and contributed to a stronger decision-making throughout the project life.
4.3 Mitigation Scenarios
The worst-case scenario that was taken into consideration was a system malfunction at the point that the registration was the most active, in a situation where the maximum number of students was visiting online at the same time. The mitigation plan that needed to be activated in this scenario was the instant initiation of a manual backup check-in procedure, with the help of pre-printed lists and the involvement of additional employees in redistribution. Infrastructure auto-scaling and real-time dashboards were created to identify the deterioration of the performance in time so that technical teams would be able to take some measures to prevent total failure.
After these controls were put into place, the residual risk was decreased to a medium level. Even though load testing and monitoring reduced the chances of the entire system failing, there was still reliance on digital infrastructure (Futai et al., 2022). Ongoing risk was also experienced due to human factors including familiarity of the staff with fallback procedures. Rehearsals and training were therefore conducted on a regular basis so that mitigation measures would be put into practice. Such a situation showed the need to have both technical controls and operational preparedness to deal with high-impact risks in occurrences that are time-sensitive.
Reflection on Role, Team Dynamics, and SCRUM Leadership
5.1 Individual Role
My primary role within the project was that of a SCRUM Coordinator and Delivery Support member, focusing on facilitating Agile processes rather than direct data analysis. I supported sprint planning sessions by helping structure sprint goals, coordinating task allocation, and ensuring alignment between analytical outputs and sprint priorities. I was actively involved in organising stand-ups, tracking sprint progress on Trello, and supporting the timely resolution of blockers raised by team members. An innovative contribution was encouraging the structured use of sprint boards during discussions, which improved task visibility and accountability (Ihenacho, 2025). This role enabled smoother coordination between technical, analytical, and organisational activities, ensuring that sprint delivery remained aligned with project objectives and stakeholder expectations throughout the project lifecycle.
5.2 Team Dynamics and Leadership
The project team demonstrated strong collaboration, openness, and shared responsibility, supported by regular communication and transparent task allocation. However, challenges included uneven familiarity with Agile practices and varying confidence in digital collaboration tools. SCRUM leadership was essential in addressing these challenges by facilitating structured ceremonies, reinforcing Agile principles, and maintaining sprint focus (Moldovan & Georgousis, 2024). Leadership encouraged adaptability while ensuring that commitments were met, creating a balance between flexibility and accountability. A key SMART development goal identified from this experience is to complete an Agile Leadership certification within six months, in order to strengthen facilitation skills, enhance stakeholder communication, and improve effectiveness when coordinating cross-functional teams.
Source: (Andrea, 2021)
5.3 Sprint Retrospective Mini-Case
During one sprint retrospective, dashboard insights revealed that queue times exceeded 120 minutes during late-morning peaks. The team agreed to reallocate staff resources and prioritise system performance checks in the following sprint. Subsequent simulations reduced average queue times to under 40 minutes, demonstrating the effectiveness of data-informed Agile decision-making (Liang & He, 2023).
Need expert support for event-based academic projects? Get professional assignment help UK for real-world case studies and reflective reports.
Appendices
Power Interest Matrix
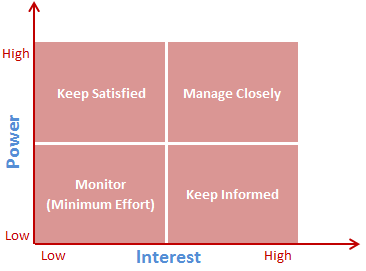
Source: (Reddi, 2023)
CATWOE Analysis Table
Dashboard
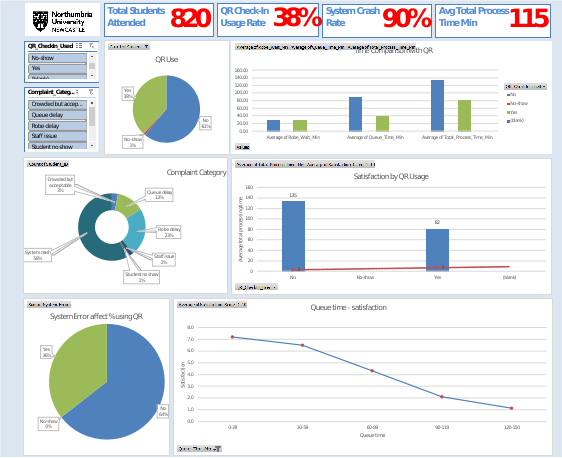
Figure 12: Dashboard
References
- Aguilar, A., & Li, R. (2023). Responsibility Assignment Matrix in Responding to Critical Outages: A Case Study of IT Incident Management Activity Process Design. https://doi.org/10.1145/3603955.3603956
- Futai, M. M., Bittencourt, T. N., Carvalho, H., & Ribeiro, D. M. (2022). Challenges in the application of digital transformation to inspection and maintenance of bridges. Structure and Infrastructure Engineering, 1-20. https://doi.org/10.1080/15732479.2022.2063908
- Haque, F., & Mathur, V. S. (2025). Construction Project Planning and Scheduling. 135-187. https://doi.org/10.1007/978-981-96-7631-6_5
- Hedges, I. (2025). Limitations of change management through agile: Why change in healthcare organizations cannot be accomplished through a traditional agile framework. Wisconsin.edu. http://digital.library.wisc.edu/1793/95296
- Ihenacho, S. (2025). Agile, Emerging Technologies, and the Future of Women-Led Innovations in STEM. African Women Trailblazers in STEM, 70-84. https://doi.org/10.1201/9781003540618-6
- Okdinawati, & Imran, J. A. (2024). A Collaborative Framework for Risk Management: Enhancing Integrated Approaches. 2021 IEEE International Conference on Industrial Engineering and Engineering Management (IEEM), 227-231. https://doi.org/10.1109/ieem62345.2024.10857266
- Lechner, D. (2025). Using Data Analytics and Dashboards in a Research Organization Environment for Project Management. Nps.edu. https://dair.nps.edu/handle/123456789/5353
- Liang, S., & He, Y. (2023). Real-Time Operational Dashboards for Executive Leadership to Drive Agile Decision-Making in Multisite Health Systems. International Journal of Advanced Computational Methodologies and Emerging Technologies, 13(11), 1-11. https://owenpress.com/index.php/IJACMET/article/view/2023-11-04
- Ma, Y. (2023, October 6). Stakeholder salience in project management. Laturi.oulu.fi. https://oulurepo.oulu.fi/handle/10024/43021
- Moldovan, A., & Georgousis, I. (2024). Navigating Scrum - The Impact of Agile Leadership and Coaching on IT Project Outcomes. DIVA. https://www.diva-portal.org/smash/record.jsf?pid=diva2:1955710
- Patmore, A. (2025). Balancing product ownership in agile delivery : a mixed-methods study in a sport technology context. Theseus.fi. http://www.theseus.fi/handle/10024/903747
- Thompson-Dyck, K., & Schalewski, L. (2023). Involving Stakeholders in the Assessment Process. Coordinating Divisional and Departmental Student Affairs Assessment, 52-66. https://doi.org/10.4324/9781003460695-4
- Wadhwa, K. (2024). The Role of Gantt Chart in the Project Management. Theseus.fi, 1(1). https://www.theseus.fi/handle/10024/865913
- Online
- Andrea. (2021, June 22). What is Scrum? | The Agile Journey with PM-Partners. PM Partners. https://www.pm-partners.com.au/insights/the-agile-journey-a-scrum-overview/
- Creately. (2024, July 9). CATWOE Analysis: Your Guide to Developing a Problem-Solving Framework | Creately. Creately.com. https://creately.com/guides/catwoe-analysis/
- Project Manager. (2018, July 23). Trello Kanban vs. Sinnaps Kanban | Cloud Project Management. Online Project Management. https://sinnaps.com/en/project-management-blog/trello-kanban
- Reddi, L. T. (2023, April 14). Stakeholder analysis using the power interest grid. Projectmanagement.com. https://www.projectmanagement.com/wikis/368897/stakeholder-analysis--using-the-power-interest-grid#_
- Singh, H. (2022, April 29). The Salience Model For Stakeholder Classification. DEEP FRIED BRAIN. https://www.deepfriedbrainproject.com/2017/09/salience-model-for-stakeholder-classification.html

UPTO55%
Avail The Benefit Today!
To View this & another 50000+ free